University uncovers personal expenditure of American on transportation comparison

Total transportation expenditures in 2016 corresponded to 15.8% of all personal expenditures, down from 18.9% in 1989. Meanwhile, analogous trends were present for the lowest and highest quintiles of income, according to a new report by the University of Michigan’s Transportation Research Institute. The report is based on data from the Consumer Expenditure Survey and performed by the Census Bureau for the Bureau of Labour Statistics.
October 3, 2017 Read time: 2 mins

Total transportation expenditures in 2016 corresponded to 15.8% of all personal expenditures, down from 18.9% in 1989. Meanwhile, analogous trends were present for the lowest and highest quintiles of income, according to a new report by the 5594 University of Michigan’s Transportation Research Institute.

The report is based on data from the Consumer Expenditure Survey and performed by the Census Bureau for the Bureau of Labour Statistics. It compared expenditures for all households as well as those at two extremes of income in 1989 and 2016.

Other findings include a higher relative expenditure for gasoline and motor oil for the lowest quintile of income than for the highest quintile of income. Secondly, transportation accounted for the second largest budget category in both 2016 and 1989. Meanwhile, transportation expenditures relative to the expenditures for housing and food decreased. In addition, transportation expenditures for the lowest quintile of income were lower than food expenditures in both years, contrasting transportation expenditures for the highest quintile of income were higher than food expenditures in both years. Finally, transportation expenditure adjusted for inflation decreased by 11.3% from 1989 to 2016.

Related Content

  • July 1, 2016
    UK road safety’ is stagnating’ – IAM and RoSPA call for new strategy
    Independent road safety charity IAM RoadSmart and safety charity the Royal Society for the Prevention of Accidents (RoSPA) have called for government action following the release of the Department for Transport’s (DfT) reported road casualties in Great Britain 2015. The 2015 figures show there were 1,732 reported road deaths – two per cent fewer compared with 2014. According to the DfT, this is the second lowest annual total on record after 2013. The number of people seriously injured in reported road tr
  • September 6, 2017
    Remote remedies help US authorities identify bridge deficiencies
    Every day 185 million vehicles – cars, trucks, school buses, emergency response units - cross one or more of America’s 55,710 'structurally compromised' steel and concrete road bridges, the highest concentration of which are in Iowa (nearly 5,000), Pennsylvania and Oklahoma. Nearly 2,000 of these crossings are located on interstate highways, according to the American Road and Transportation Builders Association's recent analysis of the US Department of Transportation's 2016 National Bridge Inventory.
  • June 30, 2020
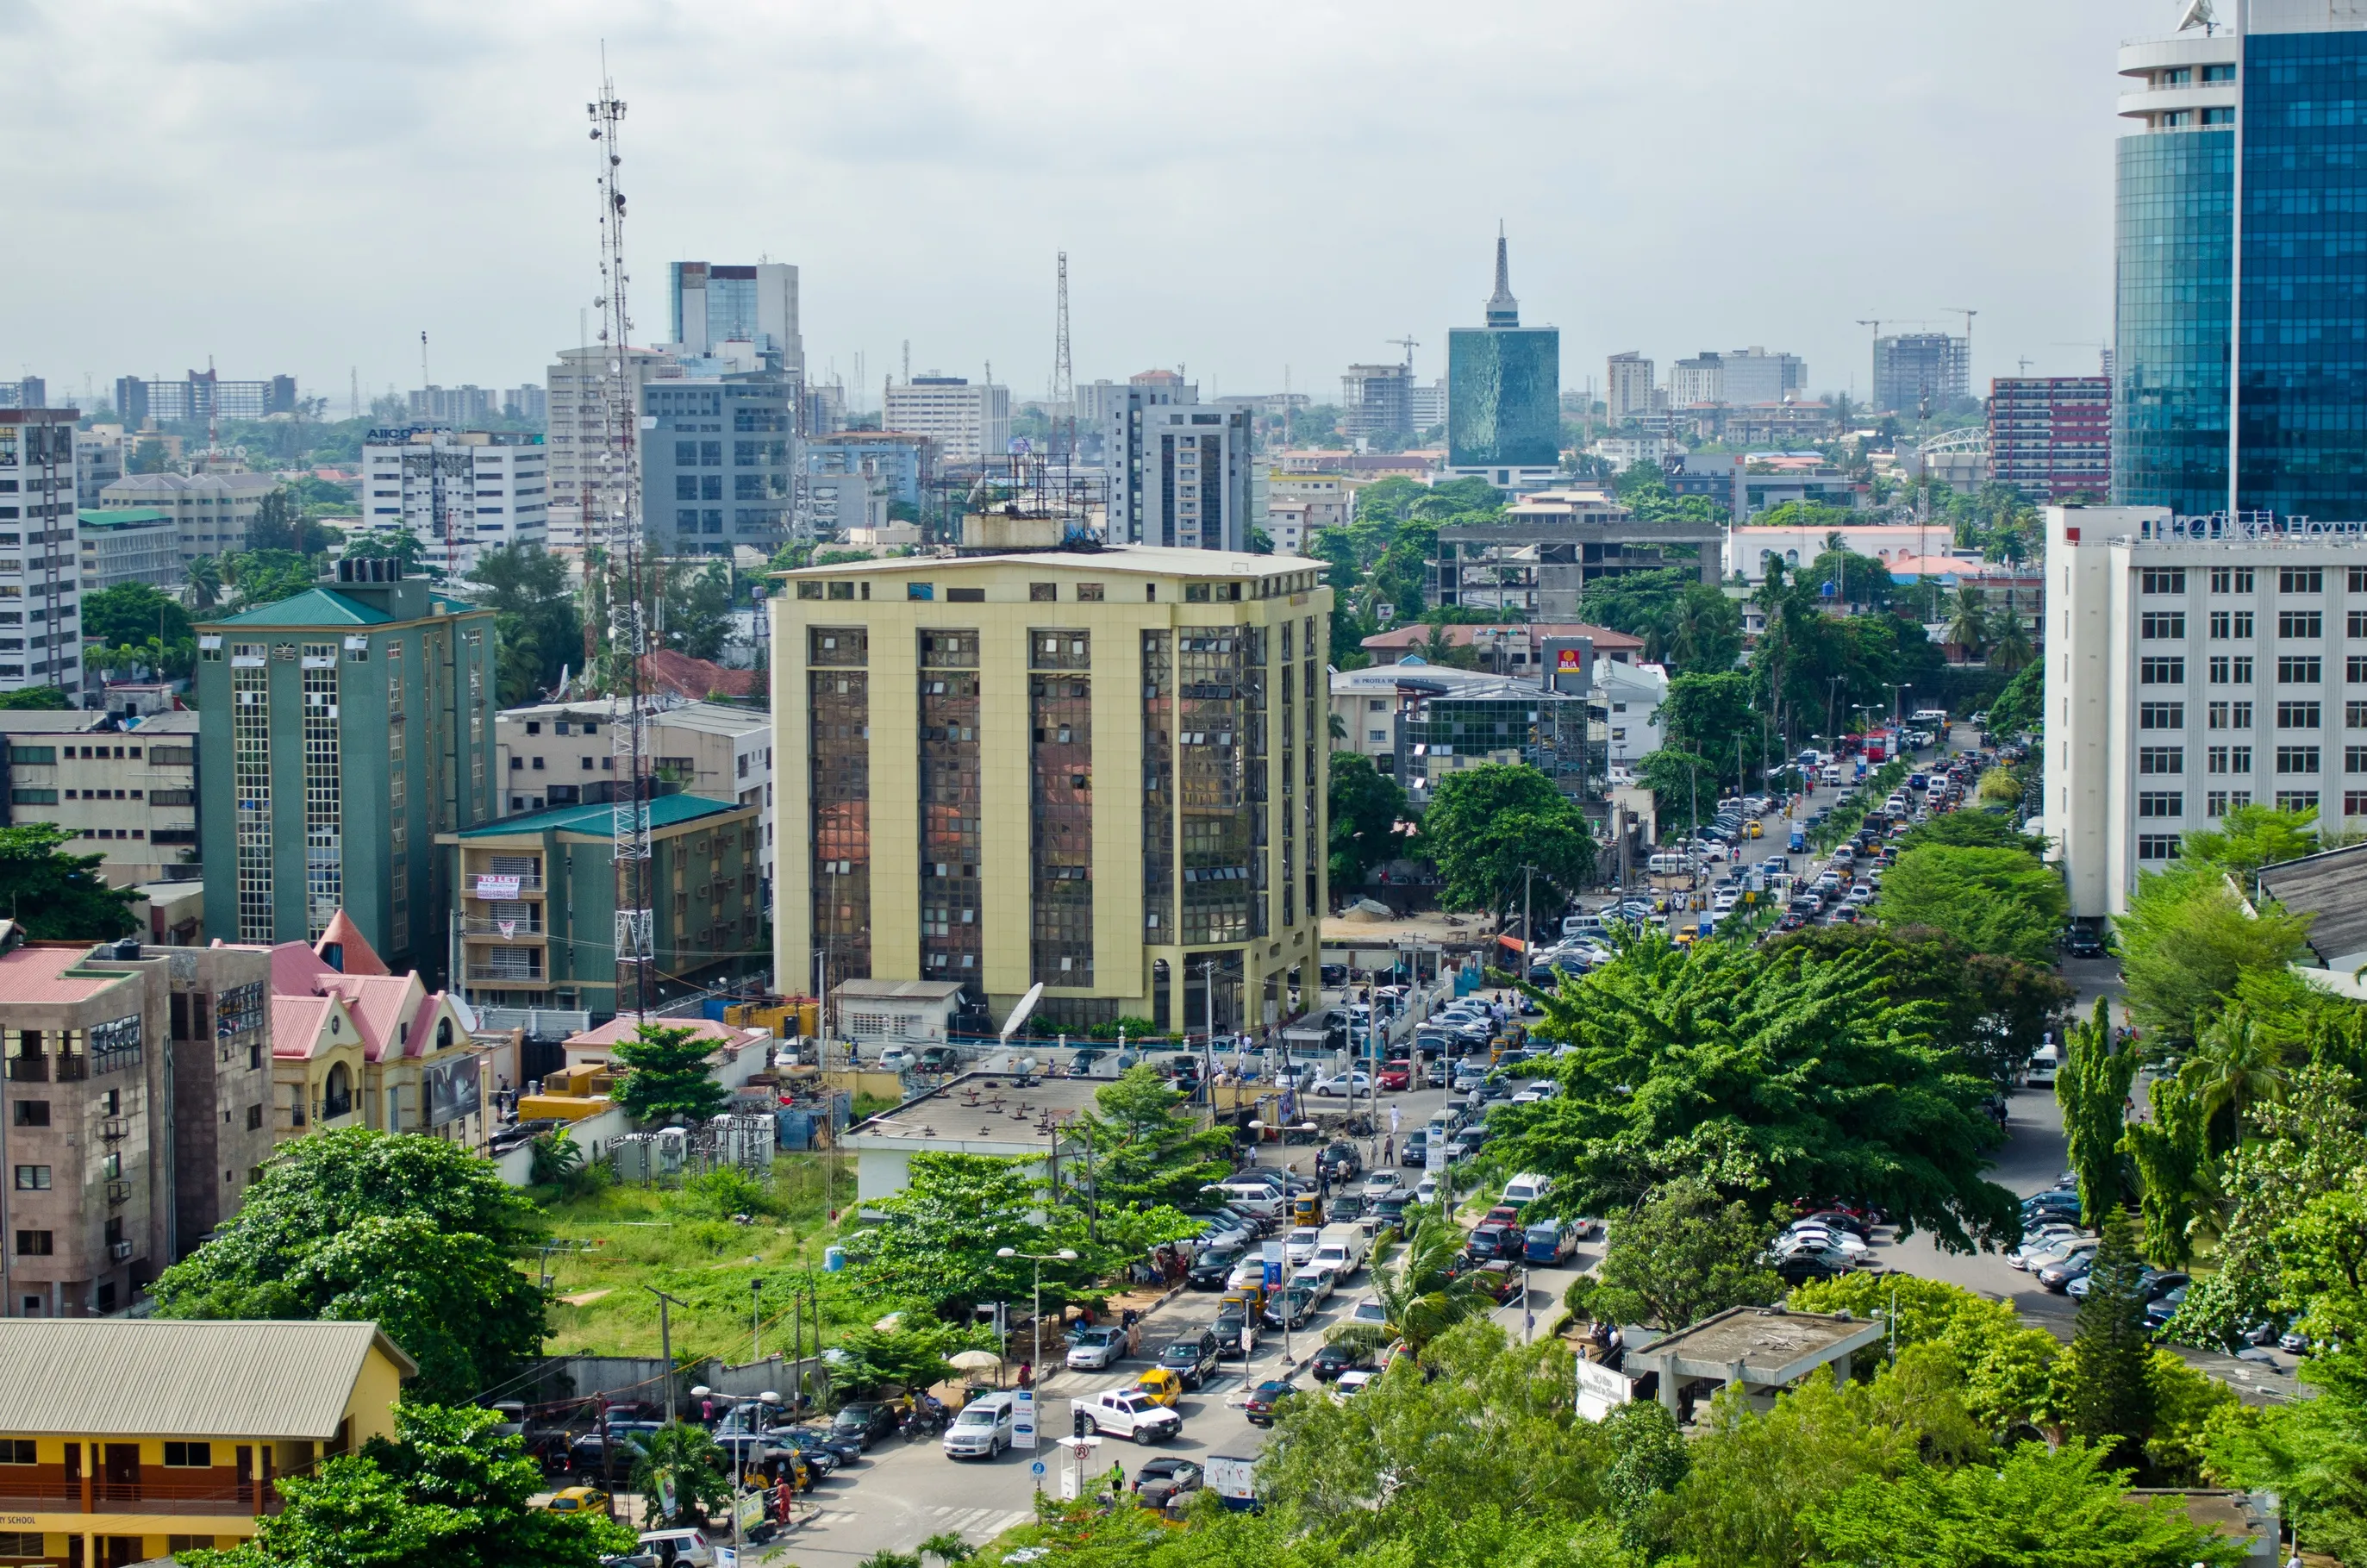
    Lagos would welcome careful drivers
    An index has revealed the most dangerous parts of the world for car crashes, with cities in Africa, the US, India and Russia particularly challenging – although the rest of us might head to Calgary in Canada.
  • June 8, 2015
    Sprawl spreads the costs and confines the benefits
    A new report says car-centric planning leads to inefficient cities and divided communities as lead author Todd Litman explains. Between 1950 and 2050 the human population will have approximately quadrupled and shifted from 80% rural to nearly 80% urban; by the middle of this century the United Nations predicts an additional 2.2 billion urban residents in developing countries than there are today. How these cities grow has huge economic, social and environmental impacts and implementing proper policies can c