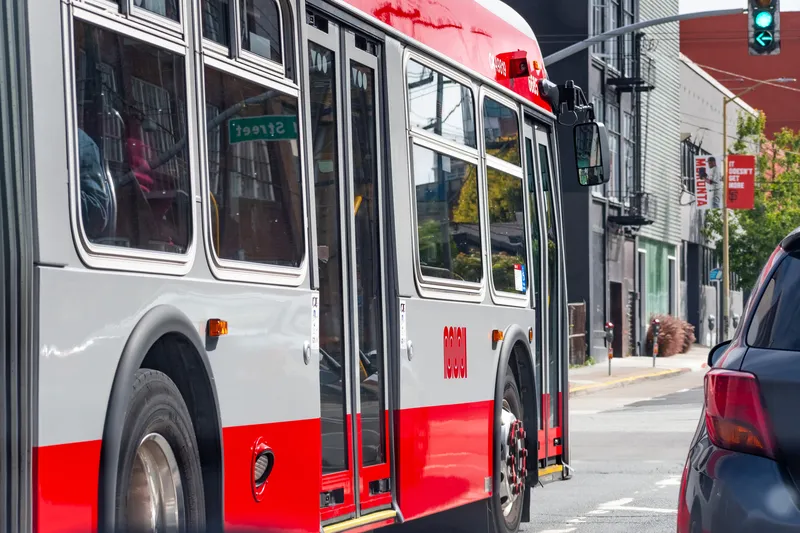
New research from the Accessibility Observatory at the University of Minnesota ranks 46 of the 50 largest (by population) metropolitan areas in the US for accessibility to jobs by transit.
The new rankings, part of the Access Across America study begun last year, focus on accessibility, a measure that examines both land use and transportation systems. Accessibility measures how many destinations, such as jobs, can be reached in a given time.
In the study, rankings were determined by a weighted average
October 10, 2014
Read time: 2 mins
New research from the Accessibility Observatory at the 584 University of Minnesota ranks 46 of the 50 largest (by population) metropolitan areas in the US for accessibility to jobs by transit.
The new rankings, part of the Access Across America study begun last year, focus on accessibility, a measure that examines both land use and transportation systems. Accessibility measures how many destinations, such as jobs, can be reached in a given time.
In the study, rankings were determined by a weighted average of accessibility, giving a higher weight to closer jobs. Jobs reachable within ten minutes were weighted most heavily; jobs were given decreasing weight as travel time increases up to 60 minutes. Travel times were calculated using full transit schedules for the 7:00 to 9:00 a.m. period. The calculations include all components of a transit journey, including “last mile” access and egress walking segments and transfers.
“Accessibility is the single most important measure in explaining the effectiveness of the urban transportation system,” says David Levinson, University of Minnesota civil engineering professor and principal investigator on the project.
According to Owen, accessibility can be measured for various transportation modes, to different types of destinations, and at different times of day. “There are a variety of ways to define accessibility,” Owen explains, “but the number of destinations reachable within a given travel time is the most directly comparable across cities.”
The top metro area for job accessibility by transit was New York, followed by San Francisco, Los Angeles, Washington, Chicago, Boston, Philadelphia, Seattle, Denver and in tenth place, San Jose.
“This project provides the most detailed evaluation to date of access to jobs by transit,” says Andrew Owen, director of the Observatory. “We directly compare the transit accessibility performance of America’s largest metropolitan areas.”


