According to the US Department of Transportation's recently-released 2015 National Bridge Inventory database, there were 2,574 fewer structurally deficient bridges in 2015 compared to the number in 2014. However, there are still 58,500 on the structurally deficient list and at the current pace of bridge investment it would take at least 21 years before they were all replaced or upgraded.
The American Road & Transportation Builders Association (ARTBA), which conducts an annual review of state bridge da
February 19, 2016
Read time: 2 mins
According to the 324 US Department of Transportation's recently-released 2015 National Bridge Inventory database, there were 2,574 fewer structurally deficient bridges in 2015 compared to the number in 2014. However, there are still 58,500 on the structurally deficient list and at the current pace of bridge investment it would take at least 21 years before they were all replaced or upgraded.
The5565 American Road & Transportation Builders Association (ARTBA), which conducts an annual review of state bridge data collected by the federal agency, found that about 9.5 per cent of the nation's approximately 610,000 bridges are classified as structurally deficient, but cars, trucks, school buses and emergency vehicles cross these deficient structures nearly 204 million times a day.
To help ensure public safety, bridge decks and support structures are regularly inspected by the state transportation departments for deterioration and remedial action. Unfortunately, the funding made available to state and local transportation departments for bridge work is not keeping pace with needs.
While these bridges may not be imminently unsafe, the purpose of the report, the association said, is to help educate the public and policymakers that they have structural deficiencies that need repair.
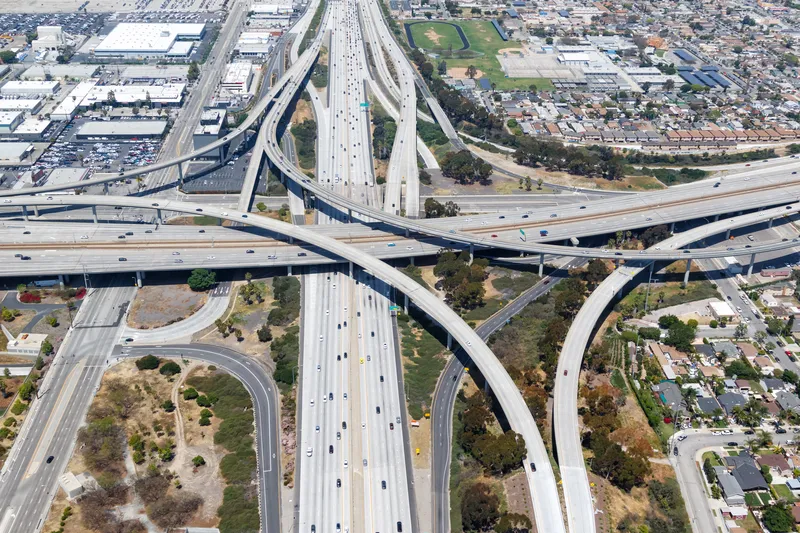
Almost all of the 250 most heavily crossed structurally deficient bridges are on urban highways, particularly in California. Nearly 85 per cent were built before 1970.
"Every year we have new bridges move on the list as structures deteriorate, or move off the list as improvements are made," says Dr Alison Premo Black, ARTBA's chief economist, who conducted the analysis. In the 2015 report, there were 4,625 structurally deficient bridges that were not so classified in 2014, she says. On the positive side, about 7,200 bridges classified as structurally deficient in 2014 were repaired, replaced, rebuilt or removed from the 2015 inventory. The net effect, Black says, is a slow national reduction in the overall number of structurally deficient structures.
Black notes the recently-enacted five-year federal highway and transit law provides a modest increase in funding for bridge repairs. But "the funding made available won't come close to making an accelerated national bridge repair program possible," she said. "It's going to take major new investments by all levels of government to move toward eliminating the huge backlog of bridge work in the United States."
The
To help ensure public safety, bridge decks and support structures are regularly inspected by the state transportation departments for deterioration and remedial action. Unfortunately, the funding made available to state and local transportation departments for bridge work is not keeping pace with needs.
While these bridges may not be imminently unsafe, the purpose of the report, the association said, is to help educate the public and policymakers that they have structural deficiencies that need repair.
Almost all of the 250 most heavily crossed structurally deficient bridges are on urban highways, particularly in California. Nearly 85 per cent were built before 1970.
"Every year we have new bridges move on the list as structures deteriorate, or move off the list as improvements are made," says Dr Alison Premo Black, ARTBA's chief economist, who conducted the analysis. In the 2015 report, there were 4,625 structurally deficient bridges that were not so classified in 2014, she says. On the positive side, about 7,200 bridges classified as structurally deficient in 2014 were repaired, replaced, rebuilt or removed from the 2015 inventory. The net effect, Black says, is a slow national reduction in the overall number of structurally deficient structures.
Black notes the recently-enacted five-year federal highway and transit law provides a modest increase in funding for bridge repairs. But "the funding made available won't come close to making an accelerated national bridge repair program possible," she said. "It's going to take major new investments by all levels of government to move toward eliminating the huge backlog of bridge work in the United States."


