The Inrix Traffic Scorecard 2015, which measures progress in improving urban mobility, reveals strong economic growth and record population levels resulting in London becoming the first city to surpass 100 hours wasted per driver in gridlock.
The report analysed traffic congestion in more than 100 cities worldwide. London topped the list, with drivers wasting an average of 101 hours, or more than four days, in gridlock in 2015. Across the UK, drivers spent 30 hours on average in delays last year, consist
The 163 Inrix Traffic Scorecard 2015, which measures progress in improving urban mobility, reveals strong economic growth and record population levels resulting in London becoming the first city to surpass 100 hours wasted per driver in gridlock.
The report analysed traffic congestion in more than 100 cities worldwide. London topped the list, with drivers wasting an average of 101 hours, or more than four days, in gridlock in 2015. Across the UK, drivers spent 30 hours on average in delays last year, consistent with 2014, but the UK dropped to sixth in the European ranking as a result of Switzerland seeing a rise in traffic levels. Belgium remains Europe’s most gridlocked country, with drivers stuck in traffic for 44 hours on average.
Of the 13 European countries analysed, 70 per cent experienced a decrease in congestion in 2015. This can be attributed to a sluggish Europe-wide economy, with an average quarterly GDP growth rate of 0.3 per cent in the second half of last year, which remains below the pre-crisis peak of 2008. Belgium topped the list with drivers spending 44 hours in traffic congestion, followed by the Netherlands (39 hours) and Germany (38).
Although London topped the list of Europe’s most gridlocked cities, Stuttgart experienced the highest increase, reaching 73 average hours wasted in 2015, an increase of 14 per cent from 2014. Both Cologne (5.2 hours) and Antwerp (6.6 hours) experienced significant increases in delays.
Brussels, Europe’s most congested city in 2012 and 2013, experienced a significant drop in delays in 2015, achieving 70 hours wasted in traffic, a decline of more than four hours from 2014 and moving the city to fifth in the ranking.
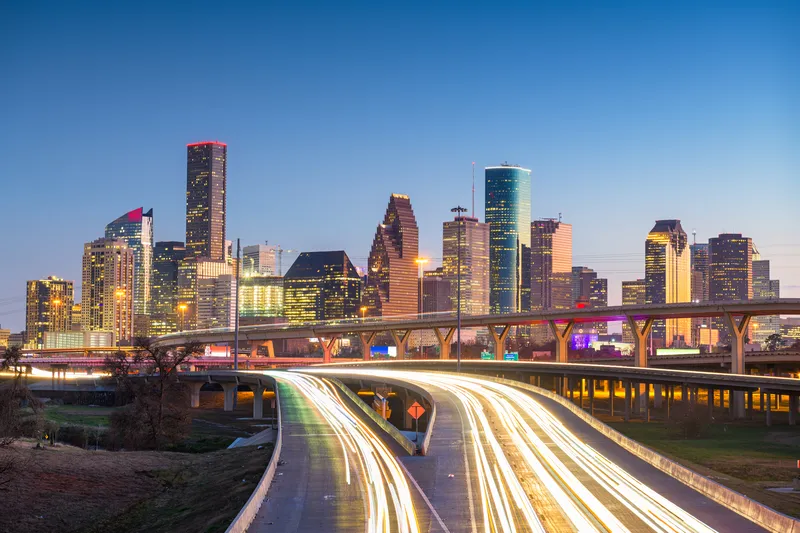
At the global city level, London tops the list of gridlock-plagued cities, with 101 hours of delay, followed by Los Angeles (81 hours), Washington DC (75), San Francisco (75), Houston (74), New York (73), Stuttgart (73), Antwerp (71), Cologne (71) and Brussels (70).
Of the countries measured by the Inrix Traffic Scorecard, the US leads with the highest annual hours wasted in traffic – an average of nearly 50 hours in 2015 – outranking Belgium (44 hours), Netherlands (39), Germany (38), Luxembourg (33), Switzerland (30), UK (30) and France (28).
The report analysed traffic congestion in more than 100 cities worldwide. London topped the list, with drivers wasting an average of 101 hours, or more than four days, in gridlock in 2015. Across the UK, drivers spent 30 hours on average in delays last year, consistent with 2014, but the UK dropped to sixth in the European ranking as a result of Switzerland seeing a rise in traffic levels. Belgium remains Europe’s most gridlocked country, with drivers stuck in traffic for 44 hours on average.
Of the 13 European countries analysed, 70 per cent experienced a decrease in congestion in 2015. This can be attributed to a sluggish Europe-wide economy, with an average quarterly GDP growth rate of 0.3 per cent in the second half of last year, which remains below the pre-crisis peak of 2008. Belgium topped the list with drivers spending 44 hours in traffic congestion, followed by the Netherlands (39 hours) and Germany (38).
Although London topped the list of Europe’s most gridlocked cities, Stuttgart experienced the highest increase, reaching 73 average hours wasted in 2015, an increase of 14 per cent from 2014. Both Cologne (5.2 hours) and Antwerp (6.6 hours) experienced significant increases in delays.
Brussels, Europe’s most congested city in 2012 and 2013, experienced a significant drop in delays in 2015, achieving 70 hours wasted in traffic, a decline of more than four hours from 2014 and moving the city to fifth in the ranking.
At the global city level, London tops the list of gridlock-plagued cities, with 101 hours of delay, followed by Los Angeles (81 hours), Washington DC (75), San Francisco (75), Houston (74), New York (73), Stuttgart (73), Antwerp (71), Cologne (71) and Brussels (70).
Of the countries measured by the Inrix Traffic Scorecard, the US leads with the highest annual hours wasted in traffic – an average of nearly 50 hours in 2015 – outranking Belgium (44 hours), Netherlands (39), Germany (38), Luxembourg (33), Switzerland (30), UK (30) and France (28).