Inrix identifies the worst traffic hotspots in the 25 most congested US cities

Inrix has published its latest research on the worst traffic hotspots in America. Using Inrix Roadway Analytics, a cloud-based traffic analysis tool, Inrix analysed and ranked more than 100,000 traffic hotspots in the 25 most congested US cities. The economic cost of hotspots was also calculated in terms of wasted time, lost fuel and carbon emissions over the next decade. The research identified and ranked 108,000 traffic hotspots in the 25 most congested cities in the US identified by the INRIX Global T
September 28, 2017 Read time: 3 mins
163 Inrix has published its latest research on the worst traffic hotspots in America. Using Inrix Roadway Analytics, a cloud-based traffic analysis tool, Inrix analysed and ranked more than 100,000 traffic hotspots in the 25 most congested US cities. The economic cost of hotspots was also calculated in terms of wasted time, lost fuel and carbon emissions over the next decade.


The research identified and ranked 108,000 traffic hotspots in the 25 most congested cities in the US identified by the INRIX Global Traffic Scorecard, which provides an ‘Impact Factor’, based on the duration, length and frequency of traffic jams.

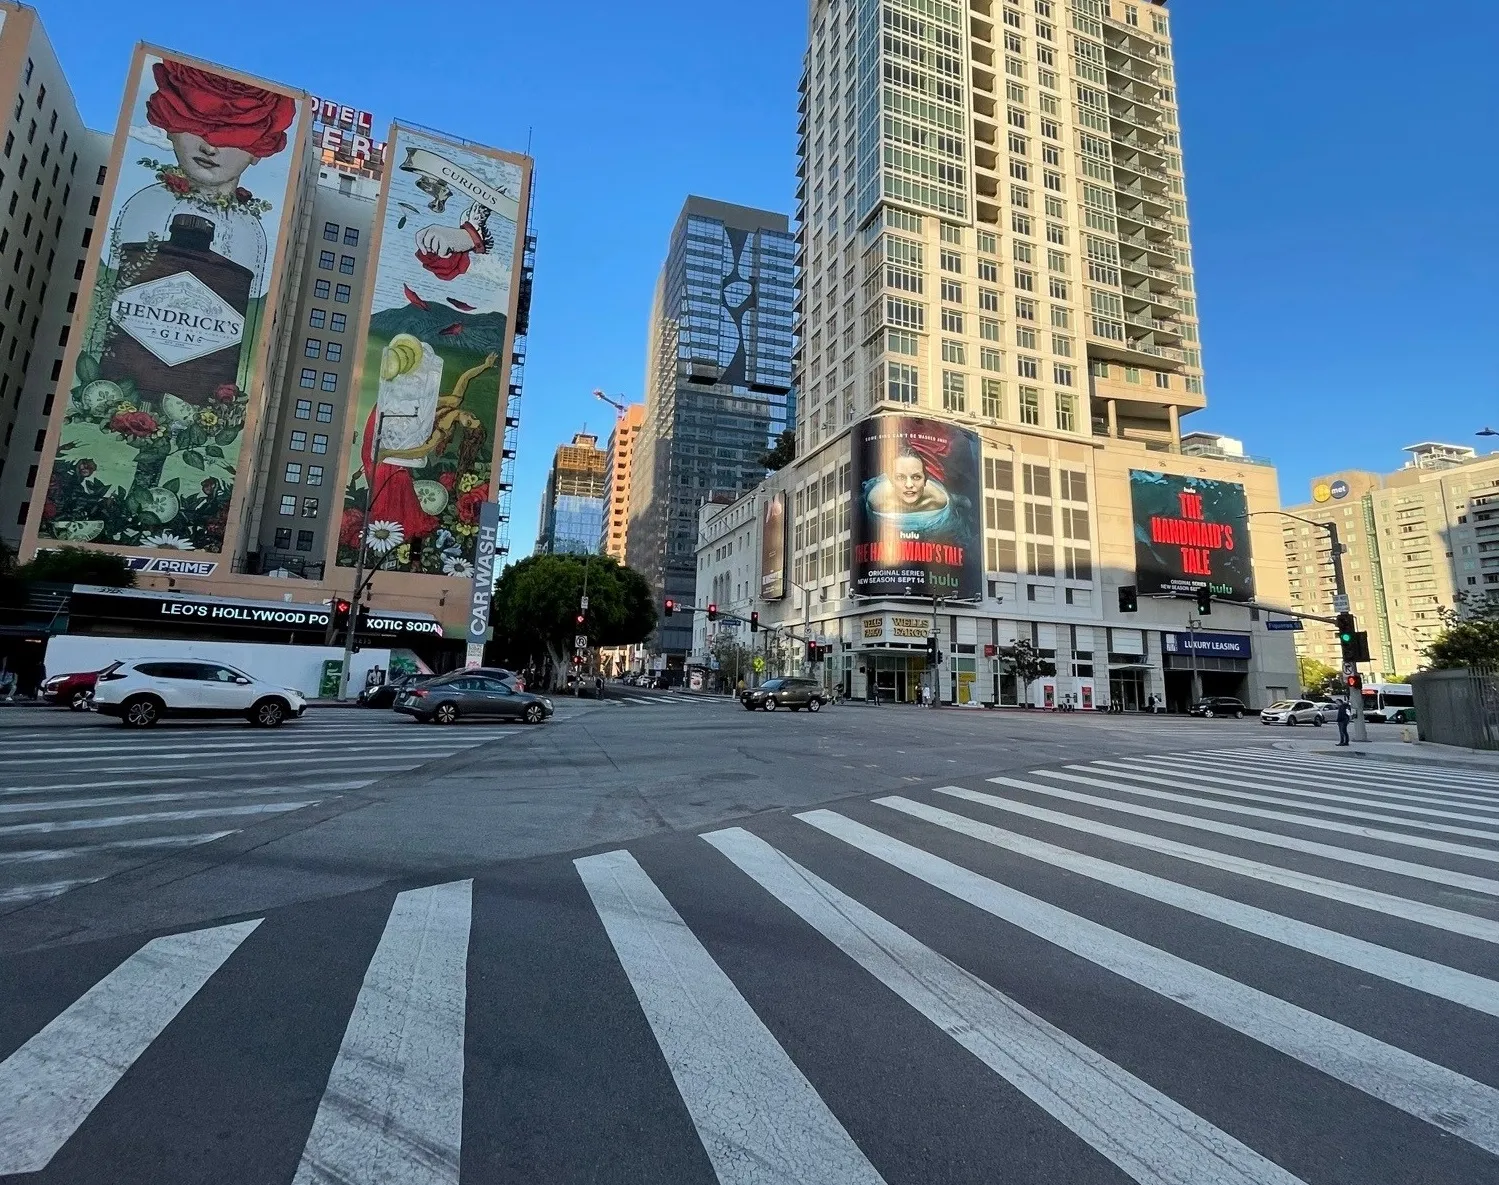
New York had more traffic hotspots (13,608) than any other city analysed. However, Los Angeles topped the ranking with the highest overall impact factor, due to the severity as well as the high number of hotspots (10,385). This also means LA pays the highest price, with congestion at these locations potentially costing drivers US$91 billion by 2026, if congestion doesn’t improve.

The impact of LA hotspots, and the potential cost to drivers, was 42 percent higher than the second ranked city, New York, and three times higher than Washington DC (ranked third). Atlanta and Dallas round out the top five, with Chicago, San Francisco, Houston, Miami and Boston making up the top 10. The economic cost to drivers due to wasted time, fuel and emissions in the 25 cities amounts to US$481 billion by 2026. When extrapolated to a national level, traffic hotspots could total almost US$2.2 trillion over the next decade.

I-95, in the Washington DC region, was identified as the worst overall traffic hotspot, which caused 1,384 traffic jams over the study period, stretching 6.47 miles and lasting 33 minutes on average.

However, the research shows initiatives like the 7775 Illinois Tollway congestion relief project are proving successful at increasing speeds. The Tollway authority recently added a lane in each direction on I-90, which increased westbound peak hour travel speeds by 64 per cent. It also activated ‘smart’ features, such as dynamic travel times, active lane management and “shoulder running” for buses or emergency vehicles.

Other cities around the country are making strides to reduce congestion and improve travel times. Although in the early stages, state and local governments have support to enact long-term transportation programs to ease congestion like Atlanta’s Transform 285/400, Measure M in Los Angeles, New York’s BQE Atlantic to Sands and Connecting Washington in Washington state.

For more information on companies in this article

Related Content

  • Fifth annual Inrix traffic scorecard released
    May 23, 2012
    Inrix, a leading international provider of traffic information and intelligent driver services, has released its fifth Annual Inrix Traffic Scorecard revealing a startling 30 per cent drop in traffic congestion in the US in 2011. In the report, which also scores Europe, 70 of America’s top 100 most populated cities showed decreases in traffic congestion last year. The report concludes these results are indicative of a ‘stop-’n’-go economy’ where lack of employment combined with high fuel prices is keeping A
  • StreetLight Data reveals most dangerous US cities for pedestrians
    July 3, 2023
    Research comes as GHSA says pedestrian deaths in US reached a 41-year high in 2022
  • Congestion up globally says TomTom
    March 23, 2016
    According to TomTom’s latest Traffic Index, traffic congestion has increased 13 per cent globally since 2008. But there are big differences between continents; while North America’s traffic congestion has jumped by 17 per cent, Europe has risen just two per cent. TomTom believe the contrasts probably are driven by economic growth in North America and financial troubles in the many parts of Europe. In particular, some countries have recorded a marked drop in traffic over the past eight years, including It
  • 'Significant and universal decline' in walking in the US: StreetLight Data
    February 16, 2024
    Walking has declined over the last three years in the US – yet pedestrian fatalities have been rising. Adam Hill looks at new research from StreetLight Data to find out why this is happening