Inrix, a leading international provider of traffic information and intelligent driver services, has released its fifth Annual Inrix Traffic Scorecard revealing a startling 30 per cent drop in traffic congestion in the US in 2011. In the report, which also scores Europe, 70 of America’s top 100 most populated cities showed decreases in traffic congestion last year. The report concludes these results are indicative of a ‘stop-’n’-go economy’ where lack of employment combined with high fuel prices is keeping A
RSS163 Inrix, a leading international provider of traffic information and intelligent driver services, has released its fifth Annual Inrix Traffic Scorecard revealing a startling 30 per cent drop in traffic congestion in the US in 2011.
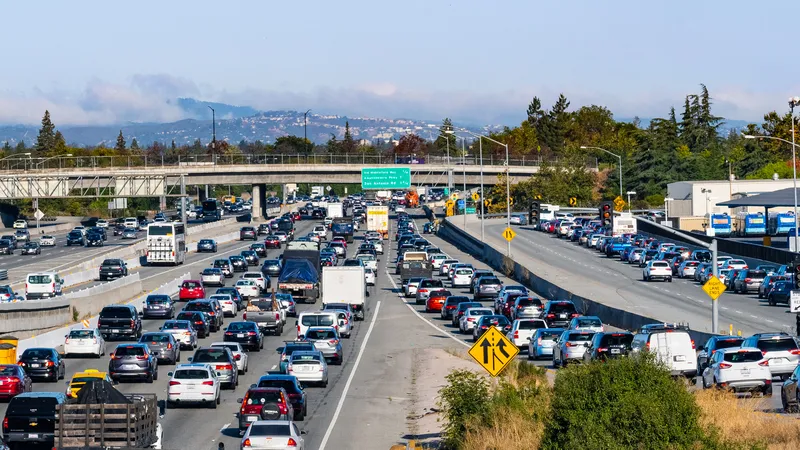
In the report, which also scores Europe, 70 of America’s top 100 most populated cities showed decreases in traffic congestion last year. The report concludes these results are indicative of a ‘stop-’n’-go economy’ where lack of employment combined with high fuel prices is keeping Americans off the roads.
“The declines in traffic congestion across the US and Europe are indicative of stalled economies worldwide,” said Bryan Mistele, Inrix president and CEO. “In America, the economic recovery on Wall Street has not arrived on Main Street. Americans are driving less and spending less fuelled by gas prices and a largely jobless recovery.”
The drop in US traffic congestion in 2011 follows two years of modest increases in 2009 (1%) and 2010 (10%). The last time America experienced a similar decline was 2008, when traffic congestion plummeted 34 per cent. When analysed in correlation with 2011 statistics from the FHWA, US Departments of Energy and Bureau of Labor Statistics, the scorecard provides as much insight into traffic as it does the economy.
Available for free as a public service from Inrix, the company claims its traffic scorecard is the definitive source on traffic congestion in the US and Europe. The report is the first of its kind to rank and provide detailed information on the 100 most congested US metropolitan areas and the 100 worst traffic corridors nationwide. In creating the Scorecard, Inrix analyses information for more than 300,000 miles of roads in the US and 250,000 km in Europe during every hour of the day to generate the most comprehensive and timely congestion analyses available.
The full report is available here.