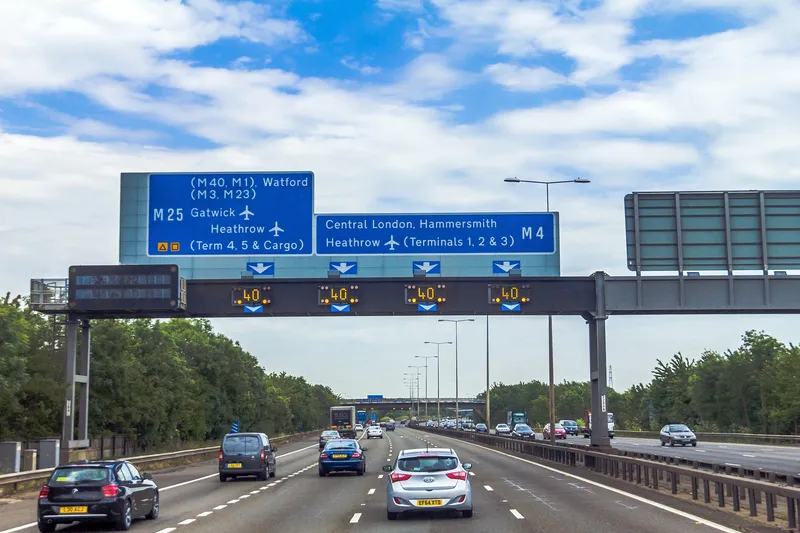
Connected vehicle (CV) data from Compass IoT is being used by Purdue University to visualise travel speeds, traffic flow and bottlenecks on motorways in the UK.
The US university has developed speed heatmaps to understand traffic flow, congestion and corridor management.
These maps enable transport agencies, local councils and national highway authorities to better understand speed variations, congestion patterns, and traffic pinch points, supporting data-driven decision-making to improve network performance - including improving incident response.

They also provide insights into when and where closures occur by visually identifying data gaps.
The research has been led by Professor Darcy Bullock, whose expertise is the use of CV data for traffic management.
"Applying connected vehicle data to UK motorways allows us to analyse congestion and speed fluctuations with a level of detail that traditional methods simply can’t provide," said Compass general manager Marinos Tsiplakis.
"Partnering with universities like Purdue enables us to combine real-world vehicle movement data with globally recognised research expertise to help authorities optimise their road networks."
The project leveraged passively-collected vehicle trajectory data for December 2024 to analyse and visualise travel speeds across key UK corridors, including the M4 and M5.
This showed, for example, the effects of motorway closure following a crash on the M4 on 12 December from 4.30am to 8pm: the maximum queue length shown on the heatmap was approximately 5-6km.
Overnight closures - part of National Highways' resurfacing scheme - on the northbound M5 from 9pm to 6am from Monday to Thursday are shown by white gaps in the heatmaps (above). The gaps indicate no vehicles travelled through that section of road for that period.
Bullock was interviewed on Compass' Byte Size podcast to discuss how connected vehicle data can help authorities to improve performance, from real-time congestion analysis to long-term corridor planning strategies.


