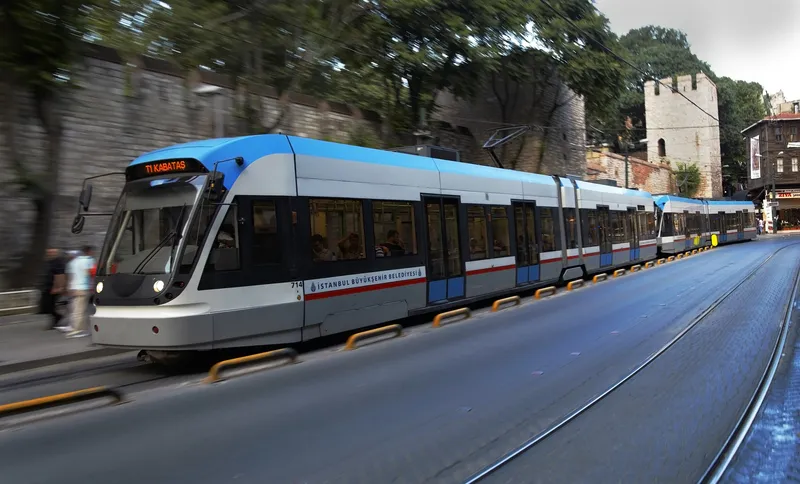
Road traffic decreased around just one venue during the US legs of Taylor Swift's recent Eras Tour: New Jersey’s MetLife Stadium - and mass transit services provide the clue as to why.
At most of the other 22 stadiums, traffic delays at least doubled as Swifties made their way to see their idol, according to new data released by StreetLight.
On average, vehicle hours of delay (VHD) on all non-local roadway segments within a one-mile radius of each stadium during the peak arrival hour of 5-6 pm on each concert date were 277% higher across all stadiums compared to delay hours at comparable times on non-concert dates.
VHD is the difference in travel time on a segment during congested versus free-flowing conditions, multiplied by the number of vehicles travelling on that roadway: this process was repeated for the same days of week within that month - excluding show dates and holidays - to determine a baseline VHD for a typical travel day.
StreetLight's research throws light on the difficulty of traffic management around major events - and the advantages of public transport in moving large numbers of people around.
The Gillette Stadium in Foxborough, MA, near Boston, saw the worst delays: they were 1,270% higher than typical on average over three nights in May 2023 - although typical VHD is "relatively low compared to many of the other venues studied", StreetLight points out.
Only four out of 23 venues saw traffic delays rise by less than 100%: MetLife, which is in East Rutherford, NJ; Mercedez-Benz Stadium in Atlanta, GA; Empower Field at Mile High in Denver, CO; and Acrisure Stadium in Pittsburgh, PA.
Roads around the Mercedez-Benz Stadium only saw a 32% increase in traffic delays - but around MetLife VHD actually decreased during the concerts, by 27% on average over the course of the three nights.
"Notably, both Atlanta and New Jersey’s concert venues were given high marks for their emphasis on public transit options to the concert," says StreetLight.
Atlanta’s Metropolitan Rapid Transit Authority System (Marta) reported seeing three times the usual ridership during the concert days at stations near the stadium, according to CBS News. NJTransit, which ran extra service around the stadium, carried 80,000 riders via train and bus to the concert, according to NJ.com.
StreetLight makes the point that the MetLife and Mercedez-Benz stadiums see higher baseline congestion than most of the other venues (apart from Las Vegas’ Allegiant Stadium).
To emphasise how difficult event traffic and crowd management can be, Philadelphia also placed a big emphasis on public transit - and this may have paid off for the stadium on two of the concert nights.
"The Friday and Sunday shows in May 2023 at Philadelphia’s Lincoln Financial Field saw below average increases in delays compared to the other stadiums, with VHD 200% and 186% higher than typical for streets around the stadium, respectively," StreetLight says in its report.
"However, on Saturday night Philadelphia’s Lincoln Financial Field encountered huge snarls, with a 599% increase in hours of delay. This dragged down the stadium’s average across the three nights. It’s also a signal of how tenuous traffic management at an event like this can be, and how easy it is for delays to compound."
The new report expands on StreetLight’s prior analysis of nine stadiums that hosted Eras Tour concerts in March–May 2023.