In London, £264m ($354m) is lost each year, followed by Manchester (£169,256,880) ($227,486,467) and the Birmingham area, including Wolverhampton (£144,184,320) ($193,773,012).
According to the Index’s ranking of the most congested cities, London and Edinburgh both have an average congestion of 40%; with 19 and 21 working days lost per vehicle per year. In addition, Manchester has an average congestion of 38% with 21 working days lost per vehicle per year.
Traffic across the UK’s 25 most congested cities and towns increase the time each vehicle spends on the road by an average of 129 hours a year, which equates to an average commercial vehicle driver wasting more than 16 working days stuck in traffic.
Findings also revealed that traffic has been getting continuously worse since 2010, with an average journey now taking 30% longer than it would in free-flowing conditions.
Beverley Wise, director UK & Ireland for TT Telematics, said: “Traffic remains a serious issue for business and the resulting delays have potential implications for productivity, customer service standards and even employee wellbeing. Unfortunately, congestion levels continue to rise and the UK economy is paying the price for this at a time when the landscape is already challenging enough, with the growth rate now expected to be just 1.5% this year.
“But, although solutions to the wider traffic problem are incredibly complex, businesses can take action now to mitigate its effect by using data to develop smarter working schedules and shift patterns that help employees avoid driving at peak times. Technology such as telematics can help in the move towards a more dynamic model of routing and scheduling that uses data on traffic and journey times to develop plans that minimise time on the road and can be quickly adapted in reaction to delays or changing circumstances.”
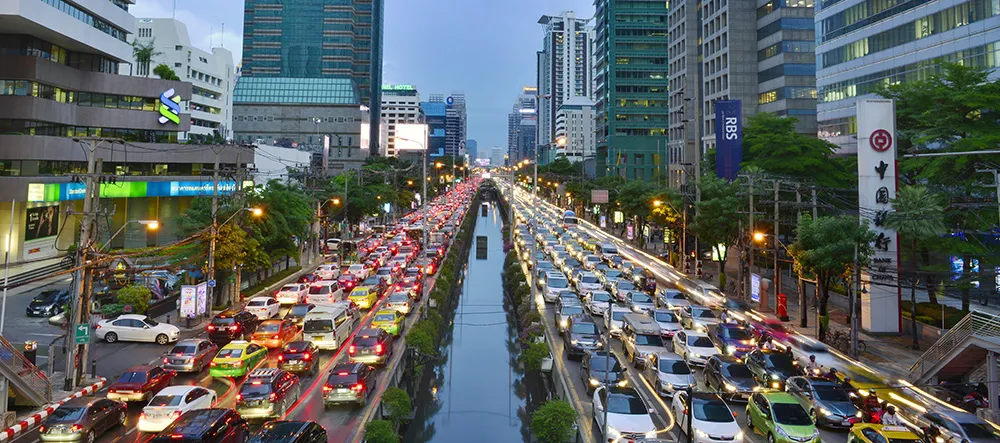
TomTom: Congestion costs on UK businesses increase by £148m
UK Congestion is costing businesses £915m ($1,229m) a year in lost productivity, according to the latest figures revealed by TomTom’s (TT’s) Traffic Index. Findings showed this figure is an increase of £148m ($198m) from last year’s £767m ($1,030m).
UK Congestion is costing businesses £915m ($1,229m) a year in lost productivity, according to the latest figures revealed by 1692 TomTom’s (TT’s) Traffic Index. Findings showed this figure is an increase of £148m ($198m) from last year’s £767m ($1,030m).