Lockdown ends - air pollution rises

Lifting of Covid restrictions sees PM2.5 levels creep up in many cities
By Adam Hill October 8, 2020 Read time: 2 mins
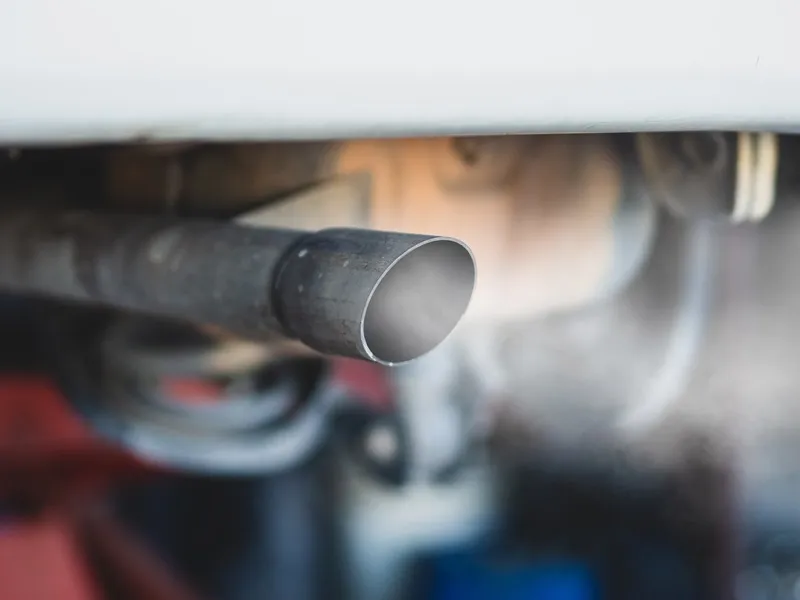
That doesn't look so good (© Wachiraphorn Thongya | Dreamstime.com)

Air pollution has increased in six out of 15 world cities since June, according to figures collated by workspace provider Instant Offices.

Using data from the World Air Quality Index, the company found that Beijing, Los Angeles, Melbourne, Madrid, Cape Town and New York have seen a double-digit increase in PM2.5 levels since lockdown ended. 

New York's PM2.5 levels fell 59% as the Covid shutdown bit - but a return towards normality has seen a 33% increase in air pollution as PM2.5 levels return close to pre-lockdown levels.

In June and July, Melbourne's air pollution increased by 17%, with Los Angeles up 16% - and Cape Town's rising 23%.

This has not been the case everywhere, however: at the height of coronavirus restrictions, air pollution fell in Hong Kong (by 16%), Sydney (13%) and Singapore (14%).

After lockdown, Hong Kong has seen a 127% drop, with Sydney (down 35%) and Singapore also seeing cleaner air.

But Instant Offices says Spanish capital Madrid has not seen air quality improvements at all, with air pollution rising by 21%.

John Williams, Instant Group head of marketing, said: “PM2.5 levels plunged across some of the world’s busiest cities, leading to improved air quality, increased visibility and even some historical moments, like the Himalayas becoming visible for the first time in 30 years in India."

“Now, as life slowly returns to normal around the world, our air quality comparison across 15 major cities reveals that while some are still benefiting from cleaner air, others have seen pollution skyrocket.”

Related Content

  • Monali Shah: "The way we move and the air we breathe is all connected"
    September 5, 2023
    Be yourself: Monali Shah of Google and ITS America tells Adam Hill how showing her personality in business has enabled her to make deeper connections on a ‘non-traditional’ journey into transportation
  • 2012 US Urban Mobility Report published
    February 8, 2013
    Researchers at the Texas A&M Transportation Institute (TTI) have come up with a way to measure the unreliability of trip times due to traffic congestion. The Planning Time Index (PTI) illustrates the amount of extra time needed to arrive on time for higher priority events, such as an airline departure, just-in-time shipments, medical appointments or especially important social commitments. If the PTI for a particular trip is 3.00, a traveller would allow sixty minutes for a trip that typically takes twenty
  • ITS investment on upward curve
    August 17, 2022
    More money is coming into the ITS sector – but where is it likely to go next? And what are the pros and cons of all this cash? Adam Hill talks to ITS veteran and corporate investment adviser Greg McKhann
  • Inrix ranks U.S. most congested developed country in the world
    February 7, 2018
    The U.S. is the most congested developed country in the world, with drivers spending an average of 41 hours a year in traffic during peak hours, costing them nearly $305bn (£220bn) in 2017, an average of $1,445 (£1,042) per driver. The findings come from Inrix’s annual Global Traffic Scorecard, which analysed 1,360 cities across 38 countries. Additionally, the study revealed that the U.S. had three of the top five most congested cities globally, costing an economic drain upwards of $2.5bn (£1.8bn). Los