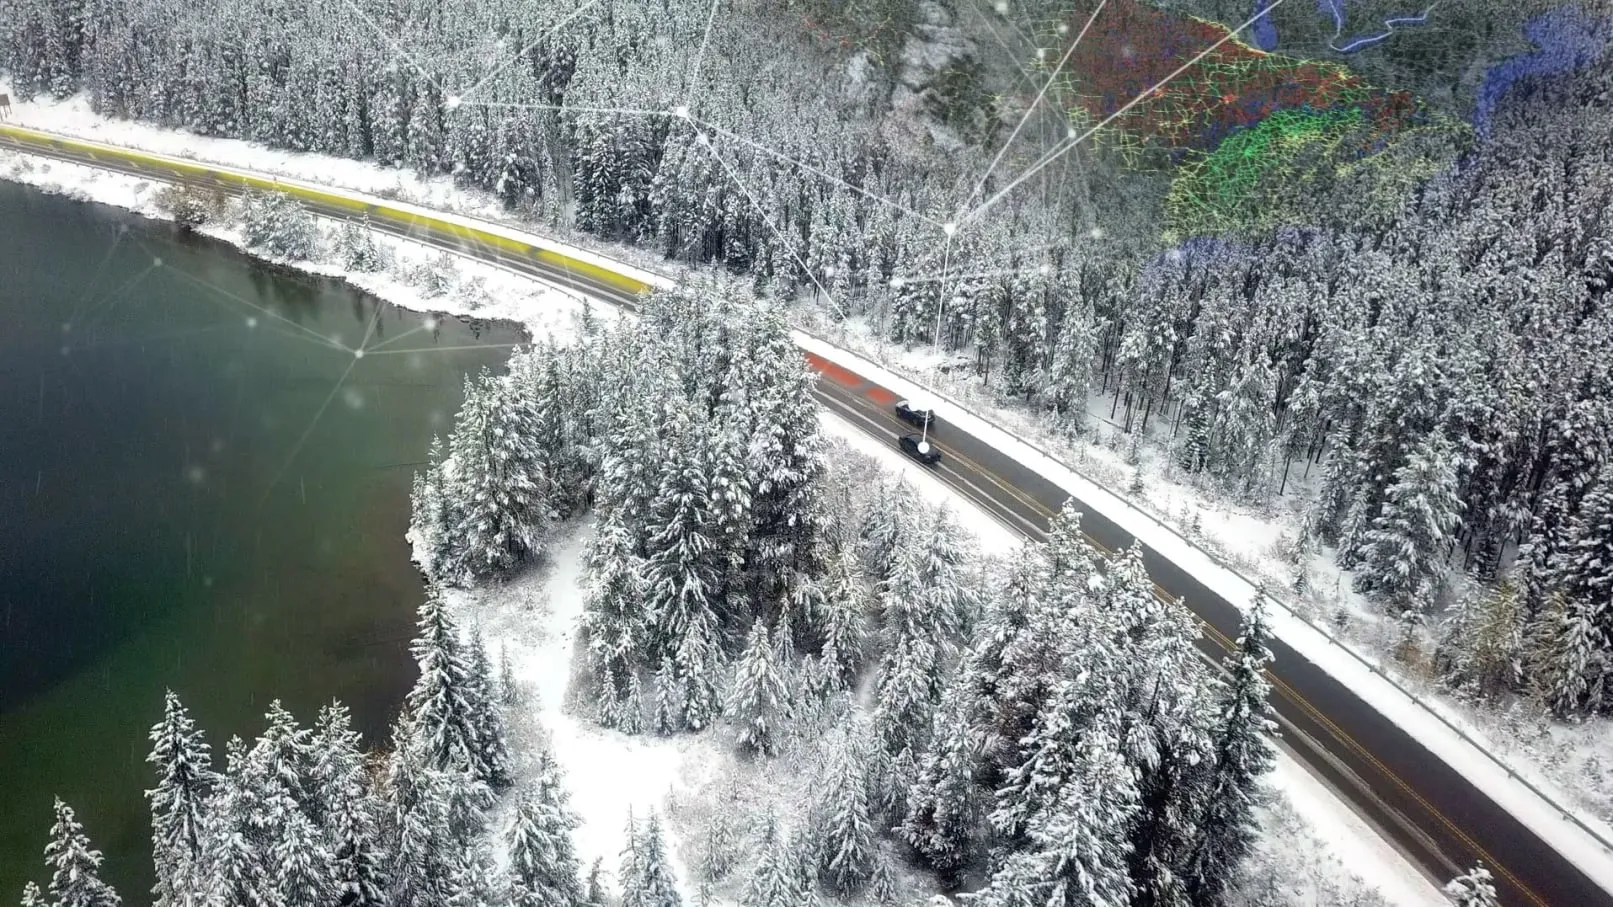
In Minnesota, US, the most common measure for snow management performance is the time it takes to completely clear a roadway after a snow event ends. Currently, the Minnesota Department of Transportation (MnDOT) relies on visual inspections by its field crews to estimate this bare pavement recovery time. To help MnDOT more accurately and reliably estimate the performance of its snow management activities, researchers from the University of Minnesota Duluth (UMD) have developed a prototype process that uses
In Minnesota, US, the most common measure for snow management performance is the time it takes to completely clear a roadway after a snow event ends. Currently, the 2103 Minnesota Department of Transportation (MnDOT) relies on visual inspections by its field crews to estimate this bare pavement recovery time.
To help MnDOT more accurately and reliably estimate the performance of its snow management activities, researchers from the University of Minnesota Duluth (UMD) have developed a prototype process that uses traffic data to help determine the roadway recovery time.
The process uses data on traffic speed, flow, and density collected by loop detectors in the twin cities metro area to estimate the point at which traffic patterns return to normal, an indicator that the roadway surface has recovered.
The project, led by UMD civil engineering professor Eil Kwon and sponsored by MnDOT, began with an evaluation of common traffic patterns during a snow event. Findings indicate that drivers travel below the speed limit during a snow event until the roadway has recovered enough to comfortably increase speed to normal levels.
The team also identified two common speed recovery patterns following a snow event. In the first pattern, speed recovery is affected only by road condition, meaning that traffic gradually returns to free-flow conditions as the road is cleared. In the second, recovery is affected by both road condition and traffic flow. In this case, speed may not reach the posted limit even with a completely clear roadway because of normal heavy traffic conditions, during rush hour for example.
For each of the two patterns, the researchers developed an automatic process that identifies specific points at which traffic speed changes during winter maintenance activities, indicating changes in the condition of the road surface. The last significant change before speed returns to normal is defined as the “road condition recovered” point.
To test the prototype process, the researchers used data from two snow-removal routes collected during the 2011–2012 season in the twin cities. Results from four different snow events show that the process was able to successfully identify speed changes and estimate road condition recovery points.
In the second phase of the project, currently under way, the researchers are refining the prototype so it can more accurately identify traffic flow recovery patterns under various conditions.