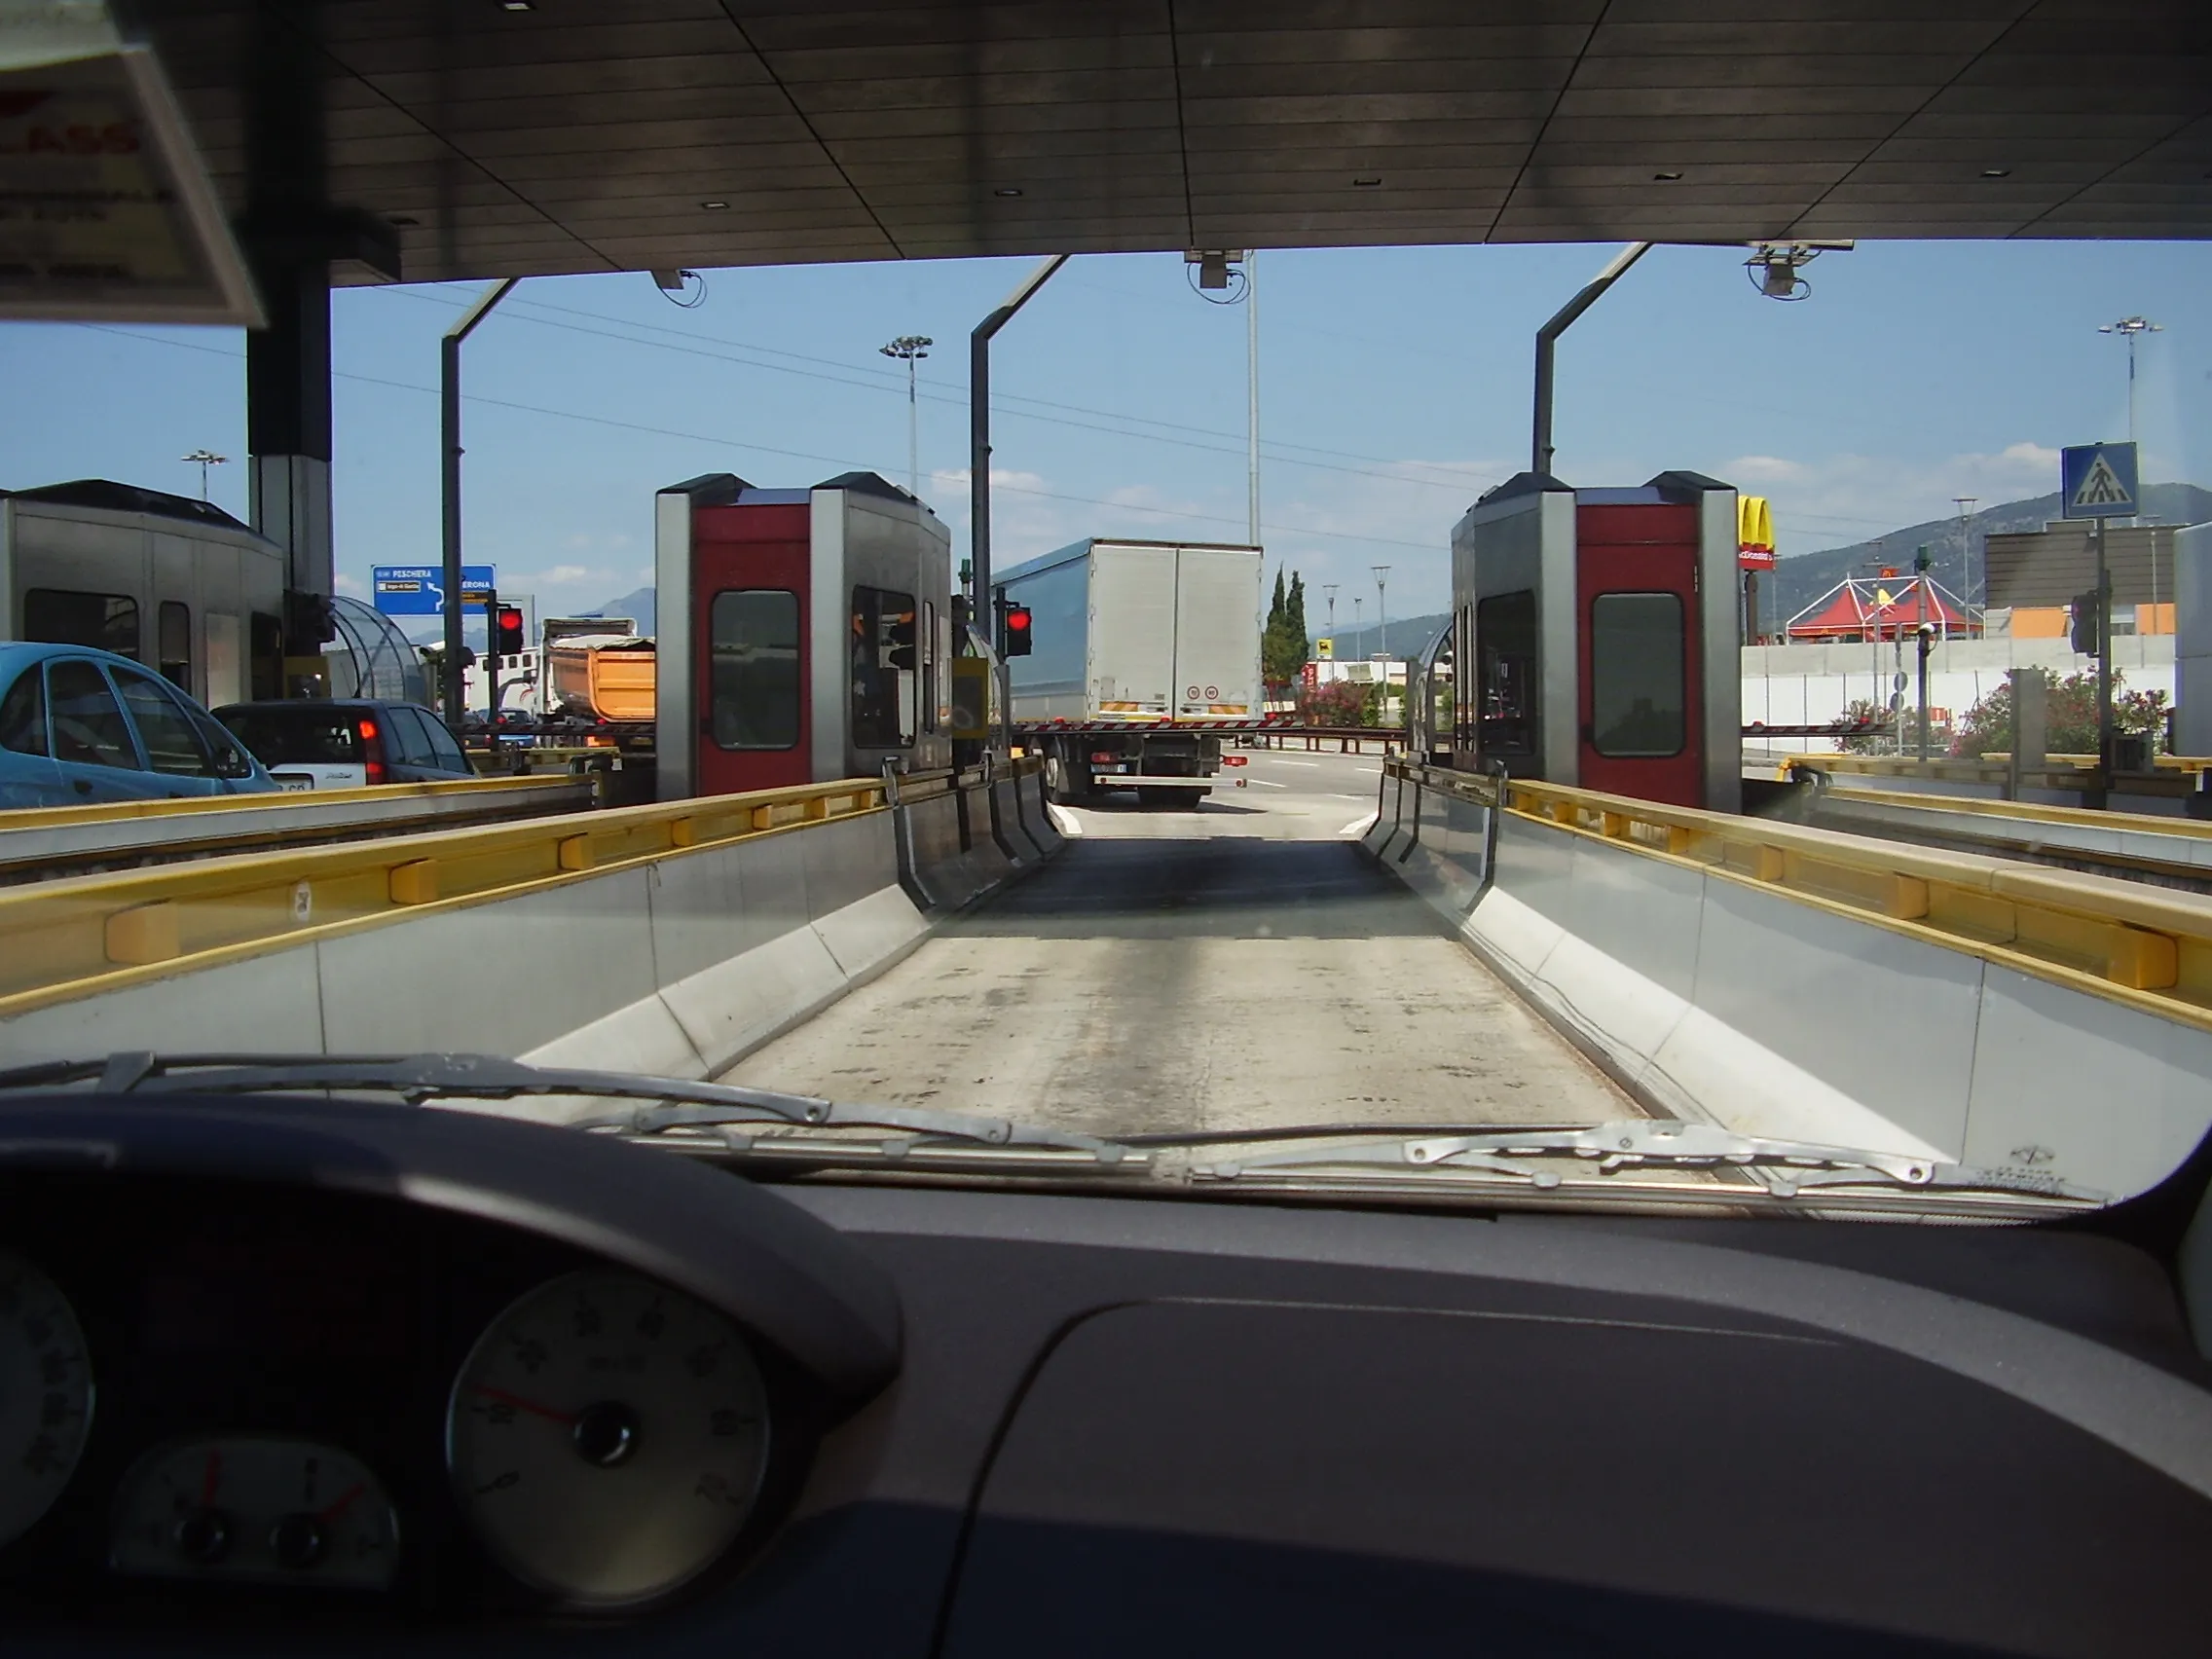
Historical traffic data provided by TomTom is being used by the local government in Spain’s Basque region to reduce road congestion at less cost.
Old habits die hard. Photos from as far back as the 1930s show people counting cars by the roadside in order to provide congestion data to those running road networks. Today, such techniques are still used, albeit augmented by a range of automation technologies such as inductive loops, infra-red sensors and number plate recognition.Even with these advances, however, the information captured covers only a small part of the road network.
For example, in the Netherlands (which boasts the highest density of roadside equipment in the world), only around 5,000km of the country’s 120,000km network is covered. What’s more, such techniques are notoriously expensive; which is something of a problem in an age where public spending is characterised by the need to save money.
But in northern Spain, the Basque Traffic Control Centre (CGTE) is now using an innovative solution to break the mould.
With historical GPS data taken from car and freight vehicles using
As CGTE’s head of traffic investigation Ignacio Eguiara puts it: “TomTom’s vehicle database is by far the most cost-effective way for us to fill the gaps in our existing traffic data network.”
World’s biggest
TomTom collects statistics on every road driven by its continually expanding user community. By connecting their devices to a computer, users can share their data anonymously. TomTom then uses this data to develop its products and come up with new ways to improve traffic flow on the road. The result is the world’s largest car-centric database. It contains over six trillion individual points of data and grows each day as TomTom adds an additional five to six billion new measurements from its customers. That equates, incidentally, to around ten million kilometres of new driving data added to the system daily.This is important for those managing the roads in north-west Spain. The CGTE is responsible for a road network that handles more than nine billion vehicle kilometres travelled every year. Large volumes of international traffic flowing between central and north-west Spain and the rest of Europe add to the significance of this task.
At the end of 2011, CGTE embarked on an ambitious project to improve safety and traffic conditions on its roads. To do this it decided to augment its traditional measurement systems with data provided by TomTom.
The result, CGTE hoped, would be a far greater ability to analyse road calming actions and to dynamically manage traffic flows.
Better insights
To begin with, historical data was used to assess the success – or otherwise – of installing various traffic-calming measures around the region. As was expected, traffic lights, speed bumps and roundabouts all contributed to slower, safer traffic flow.The value of the TomTom data, however, was that CGTE could easily quantify the success of individual schemes compared with others.
“The detail contained within the TomTom database has given us a much better insight into how our traffic schemes are working,” says Eguiara. “We have been able to learn lessons that mean we are now able to plan new schemes far better and often more cost-effectively than before.”
CGTE has also been able to use the system to tackle seasonal traffic variations. In one particularly dramatic example, Eguiara and his team decided to analyse the traffic flows which caused a 17km length of continuous traffic jam to occur every year over the busy Easter weekend.
By installing a reversible lane and operating it over the weekend, the team was able to eradicate the jam completely. The savings – in terms of fuel, emissions and time –are significant. Indeed, some government estimates put the combined economic savings as high as €500,000.
“It is clearly important to the Basque region that we are able to demonstrate economic returns such as this,” says Eguiara. “But when I think of my own budget, I am also impressed that the TomTom alternative is so affordable when compared with traditional traffic measurement technologies. And because access to the database is controlled by a credits system, we only pay for what we use.”
Furthermore, the system provides results nearly instantly. “Within 24 hours, TomTom’s system returns the kind of reports that have previously taken us months, if not years, to deliver,” says Eguiara.
Accessing world’s largest traffic database
TomTom’s professional web portal provides highly granular speed and bottleneck information for roads around the world, enabling organisations such as CGTE to manage traffic more intelligently, more dynamically and more cost-effectively than before.
It is based upon TomTom’s ever-expanding historical traffic database which currently contains more than six trillion data points. Some road segments have more than one million measurements. This makes it possible to obtain actual driven travel times and speeds on any stretch of road over any given period or time of day since 2008.
Clients access the system via a web browser. The interface allows users to make queries and view the results online or export the data for use in other software.
Queries are created in four simple steps:
1. Create a route
2. Select the calendar period
3. Define the time period to be analysed
4. Define a benchmark time period (this is usually at night)
The results can then be presented in three different formats:
1. Graphs displayed in the browser
2. Exported to
3. KML format for visual representations in


