PTV Group has launched PTV Access, a new interactive Software as a Service (SaaS) dashboard to visualise the accessibility and mobility potential of cities.
It is designed to give insight into the quality of transport infrastructure, and data about which modes work best for people.
Already available for the 50 largest German cities, PTV says it will be "gradually expanded" to include cities worldwide.
It is the first tool in what the company says will be "a new product line of data-driven, lightweight, SaaS tools for mobility analysis, management, and operation to be released in the near future as part of the company’s plans to deliver easy, accessible mobility insights to its customer base".
PTV Access is powered by PTV Model2Go, which automates the building of basic transport models.
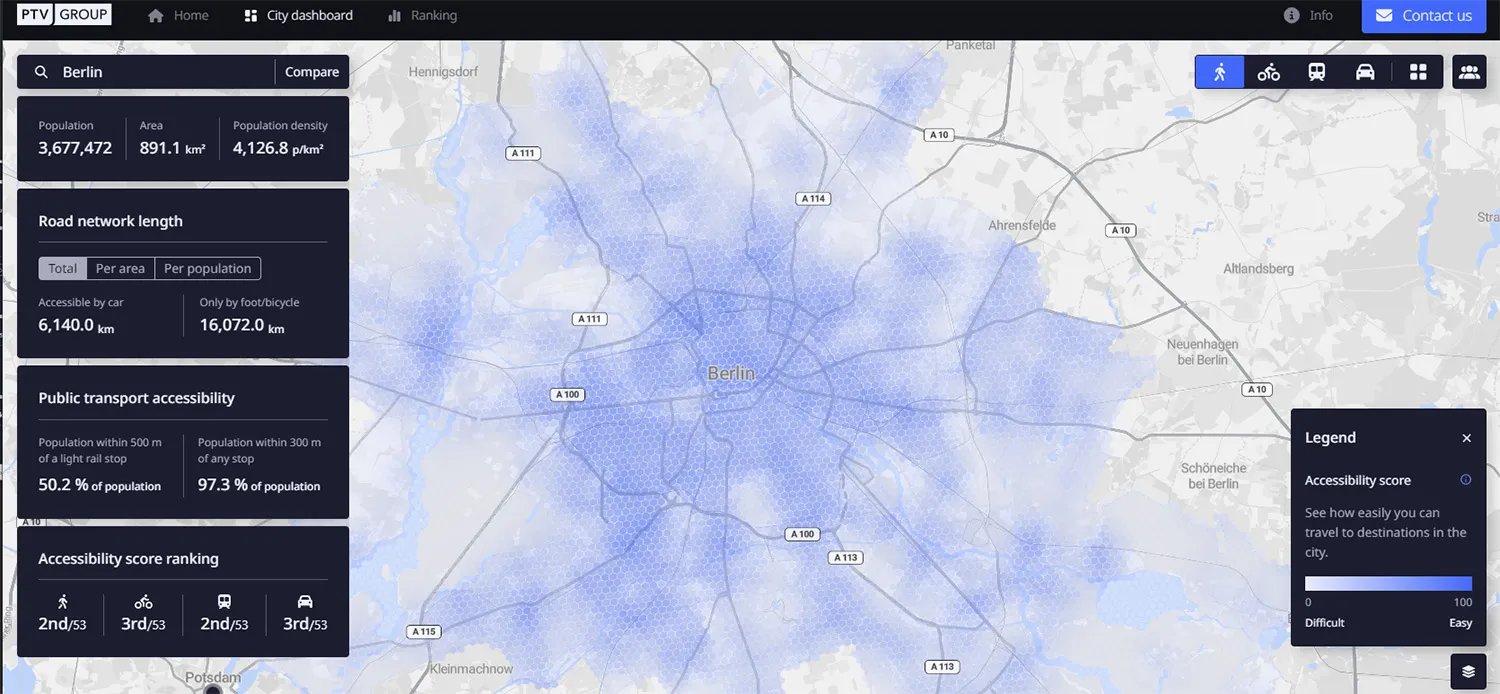
PTV has created an accessibility score for the cities currently on PTV Access: this covers how well people can reach a set of common points of interest (POIs) such as schools, hospitals and shopping areas by different modes of transport.
An additional ranking shows which cities perform best in terms of walkability, biking, public transit, and driving: Munich is at the top of the ranking for all modes of transport, with Berlin and Frankfurt in the second and third spot depending on the mode.
Users can look at the modal accessibility of different areas of the city and compare cities on the interactive map.
Other features, such as road network density and the proximity to public transport stops, are also available.
“Access to mobility, means access to society – to education, to jobs, to leisure," says Christian Haas, CEO of PTV Group. "Thus, improving accessibility also means empowering people to move forward.”
“Tools for data visualisation like PTV Access are incredibly valuable here. They empower city stakeholders to shape sustainable and inclusive urban environments focused on the citizen’s needs.”
Future additions to the dashboard are under consideration, including traffic flow, safety analysis, data customisation and embedding of results via an API.