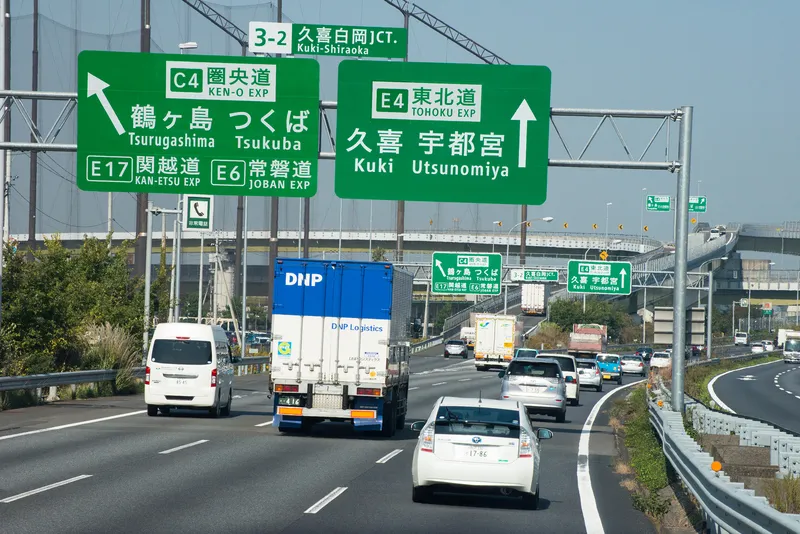
UK Road safety charity Brake is concerned by worrying new figures showing car traffic reached a new peak in 2015, with overall traffic increasing by almost 19 per cent since 1995.
According to UK government statistics, the number of vehicle miles travelled grew by 1.1 per cent in 2015, to 247.7 billion, slightly higher than the previous peak in 2007. Van traffic has continued to grow more quickly than any other vehicle type, rising 4.2 per cent from 2014 levels. Lorry traffic saw the largest year-on-year
UK Road safety charity 4235 Brake is concerned by worrying new figures showing car traffic reached a new peak in 2015, with overall traffic increasing by almost 19 per cent since 1995.
According to UK government statistics, the number of vehicle miles travelled grew by 1.1 per cent in 2015, to 247.7 billion, slightly higher than the previous peak in 2007. Van traffic has continued to grow more quickly than any other vehicle type, rising 4.2 per cent from 2014 levels. Lorry traffic saw the largest year-on-year increase since the 1980s, growing by 3.7 per cent from 2014.
Motorway use has now increased by 10 percent in the last ten years and in 2015 saw 66.5 billion vehicle miles of traffic, 2.6 per cent more than in 2014, while the use of rural roads went up by 2 per cent from 2014, and traffic on both ‘A’ roads and minor roads reached record levels.
There has been a worrying long-term decrease in the number of miles buses are now covering. From 2014 to 2015 there was a drop of 4.6 per cent in bus and coach travel. This is perhaps not surprising; there has been a decrease of 21 per cent in local authority supported bus services outside London in the last decade. A lack of public transport in some areas means many people are left with no other option than to use private vehicles.
Despite the recent increase in cycling, the amount of miles cycled in 2015, 3.2 billion, was down 6.1 per cent on the year before, after a steady increase between 2002 and 2014. Taking a longer view, cyclists in 2015 travelled only around one quarter of the 14.7 billion miles ridden in 1949.
Increases in traffic on the road network mean a greater number of interactions of vehicles and pedestrians and, therefore, increases the likelihood of crashes occurring. Per mile travelled, the risk of being killed or seriously injured in a road crash has fallen almost every year since 1949 but there was a slight increase in 2014.
Campaigns adviser for Brake, the road safety charity Alice Bailey said: “These new figures show our message of “drive less live more” is more pertinent than ever. We have record car usage in the UK along with all the congestion and pollution this brings. More traffic means more risks to vulnerable road users and danger to the health of both individuals and the planet. To see a reduction in levels of vehicle use, we need everyone to seriously consider if they really need to make that journey by car and always walk, cycle or use public transport if they can.”