Ford and StreetLight Data combine on safety  

Collision data and travel patterns are overlaid to see where road improvements are needed
By Adam Hill October 16, 2020 Read time: 2 mins
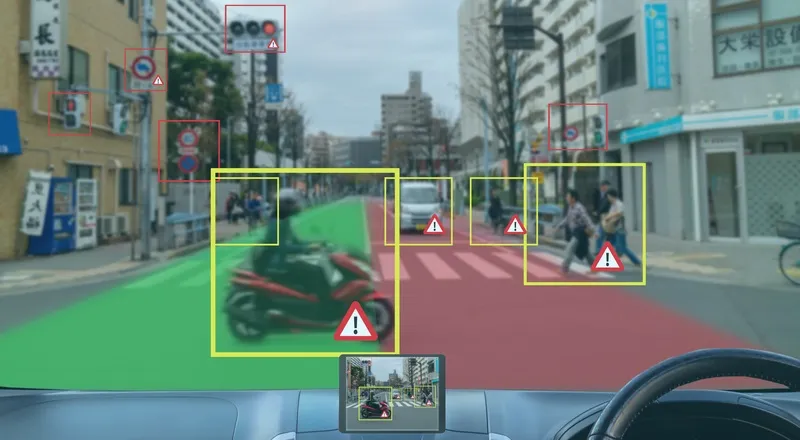
Bike, pedestrian and vehicle safety issues can be tackled, the two firms say (© Monopoly Monopoly | Dreamstime.com)

Ford Mobility and StreetLight Data have launched a data package which they say offers insights into road safety for departments of transportation and local authorities.

Safety Solutions brings together Ford’s Safety Insights tool - which uses collision data and connected vehicle input on near misses to find potential accident hotspots – and StreetLight’s Software as a Service (SaaS) platform StreetLight InSight, which supplies travel pattern data based on smartphones and navigation devices in connected vehicles, trucks and Internet of Things devices.

The new bundle can overlay crash information with vehicle, bicycle and pedestrian metrics to work out in which locations authorities should act to improve traffic safety.

“This kind of collation and analysis was previously very time-consuming and often lacked any visual representation to help planners and engineers rapidly identify, analyse and recommend countermeasures for particular safety concerns,” says Cal Coplai, product owner of Ford Mobility’s Safety Insights.

In a separate announcement, StreetLight’s data analysis has revealed that Covid-19 has changed traffic patterns in the US, shifting the morning rush hour in particular. 

Instead of the typical sharp increase in morning travel, followed by a drop and then an afternoon peak, the vehicle miles travelled (VMT) analysis shows weekday traffic building gradually toward a more sustained afternoon high.

In cities there are still ‘peak PM’ commutes – but the peaks are less pronounced.

Washington, DC, now has a slightly earlier peak for PM travel than during the same period in 2019, while Los Angeles and San Francisco have a “mini rush hour” just after lunch.

PM congestion begins earlier - but ends sooner – and there is more vehicle travel around midday than was the case last year.

For more information on companies in this article

Related Content

  • Report analyses multiple ITS projects to highlight cost and benefits
    March 16, 2015
    Every year in America cost benefit analysis is carried out on dozens of ITS installations and pilot studies and the findings, along with the lessons learned, are entered into the Department of Transportation’s (USDOT’s) web-based ITS Knowledge Resources database. This database holds more than 1,600 reports and periodically the USDOT reviews the material on file to draw conclusions from this wider body of evidence. It has just published one such review ITS Benefits, Costs, and Lessons Learned: 2014 Update Re
  • Kapsch TrafficCom: 'The city is not made for cars'
    October 22, 2018
    Traffic can be a really big challenge. When you’re stuck, you’re stuck. Everything comes to a standstill. But Alexander Lewald describes how existing infrastructures can be used more efficiently and how demand can be managed. A few figures to start with: in Los Angeles, the average driver spends 102 hours a year in traffic – that’s more than four days. This figure is 91 hours in Moscow and New York, 74 in London, 69 in Paris, 51 hours in Munich and still 40 hours in Vienna. Traffic is what causes
  • Iteris gets $9.6m green light in Orange County
    April 18, 2024
    Signal timing design, operations & maintenance are on agenda in US state of California
  • Emovis reach record number of toll transactions in Ireland 2017
    March 21, 2018
    Emovis has announced its toll interoperability cloud-based hub in Ireland has cleared more than 50 million cleared in 2017. The solution is intends to allow drivers to travel with one toll tag across the whole country. The company says there are more than 650,000 toll transponders in use as of January 2018.