Ford and StreetLight Data combine on safety  

Collision data and travel patterns are overlaid to see where road improvements are needed
By Adam Hill October 16, 2020 Read time: 2 mins
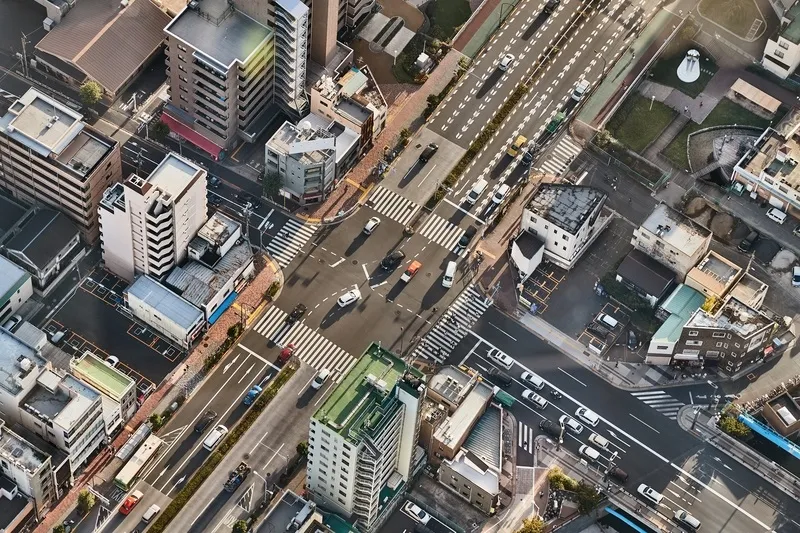
Bike, pedestrian and vehicle safety issues can be tackled, the two firms say (© Monopoly Monopoly | Dreamstime.com)

Ford Mobility and StreetLight Data have launched a data package which they say offers insights into road safety for departments of transportation and local authorities.

Safety Solutions brings together Ford’s Safety Insights tool - which uses collision data and connected vehicle input on near misses to find potential accident hotspots – and StreetLight’s Software as a Service (SaaS) platform StreetLight InSight, which supplies travel pattern data based on smartphones and navigation devices in connected vehicles, trucks and Internet of Things devices.

The new bundle can overlay crash information with vehicle, bicycle and pedestrian metrics to work out in which locations authorities should act to improve traffic safety.

“This kind of collation and analysis was previously very time-consuming and often lacked any visual representation to help planners and engineers rapidly identify, analyse and recommend countermeasures for particular safety concerns,” says Cal Coplai, product owner of Ford Mobility’s Safety Insights.

In a separate announcement, StreetLight’s data analysis has revealed that Covid-19 has changed traffic patterns in the US, shifting the morning rush hour in particular. 

Instead of the typical sharp increase in morning travel, followed by a drop and then an afternoon peak, the vehicle miles travelled (VMT) analysis shows weekday traffic building gradually toward a more sustained afternoon high.

In cities there are still ‘peak PM’ commutes – but the peaks are less pronounced.

Washington, DC, now has a slightly earlier peak for PM travel than during the same period in 2019, while Los Angeles and San Francisco have a “mini rush hour” just after lunch.

PM congestion begins earlier - but ends sooner – and there is more vehicle travel around midday than was the case last year.

For more information on companies in this article

Related Content

  • Egis in talks for Bordeaux lane-changing system
    October 8, 2015
    France-based international engineering and project installation group Egis is in discussions with Bordeaux’s city authorities to create a dynamic lane-changing system in the city.
  • Data holds the key to combating VRU casualties
    May 8, 2015
    Accident analysis software can help authorities identify common causes and make best use of their budgets, as Will Baron explains. More than 1.2 million people die on the world’s roads each year and according to the World Health Organisation, half of these are pedestrians and vulnerable road users (those whose vehicle does not have a protective shell, such as motorcyclists and cyclists). While much has been done to improve road safety and cut the number of deaths and serious injuries on our roads, a great d
  • Parsons and Amazon intersect with existing junction data
    June 12, 2020
    Parsons Corporation has launched a system which uses data already generated by sensors at intersections to improve city mobility.
  • AI and IoT show what social distancing really looks like
    April 2, 2020

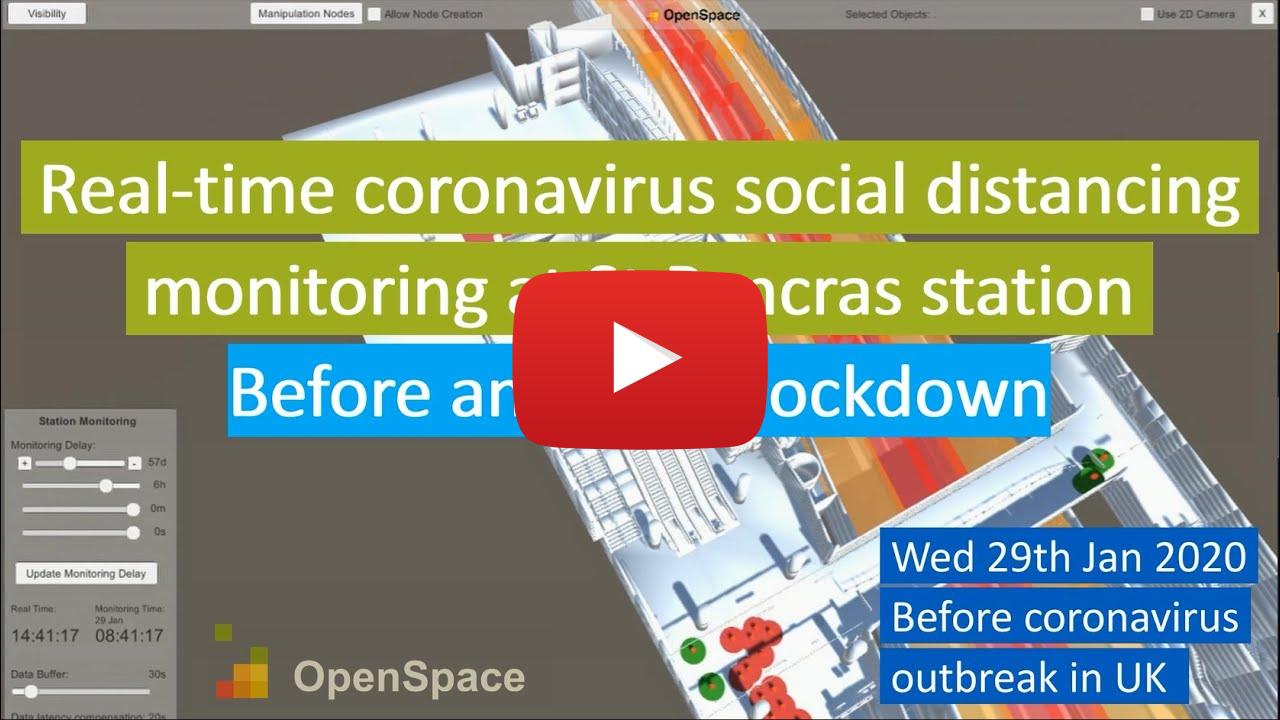
    Using AI and IoT technology, here's what real-time social distancing at St Pancras station in London looked like before the UK's 'lockdown' measures were introduced (29 January) and after (26 March).

    The red circles on OpenSpace's digital twin platform visualisation show where there is 2m or more between passengers - and the green circles show where they are too close.

    The platform has been live at St Pancras since 2019 to help station managers see current and future congestion, and suggests interventions to optimise customer experience.