Ford and StreetLight Data combine on safety  

Collision data and travel patterns are overlaid to see where road improvements are needed
By Adam Hill October 16, 2020 Read time: 2 mins
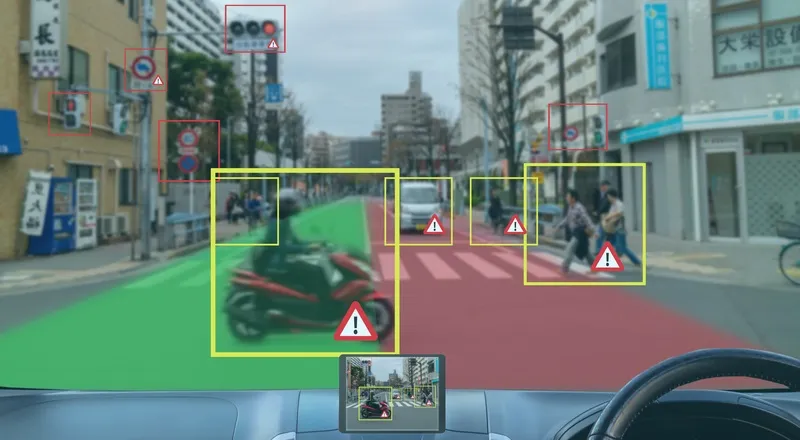
Bike, pedestrian and vehicle safety issues can be tackled, the two firms say (© Monopoly Monopoly | Dreamstime.com)

Ford Mobility and StreetLight Data have launched a data package which they say offers insights into road safety for departments of transportation and local authorities.

Safety Solutions brings together Ford’s Safety Insights tool - which uses collision data and connected vehicle input on near misses to find potential accident hotspots – and StreetLight’s Software as a Service (SaaS) platform StreetLight InSight, which supplies travel pattern data based on smartphones and navigation devices in connected vehicles, trucks and Internet of Things devices.

The new bundle can overlay crash information with vehicle, bicycle and pedestrian metrics to work out in which locations authorities should act to improve traffic safety.

“This kind of collation and analysis was previously very time-consuming and often lacked any visual representation to help planners and engineers rapidly identify, analyse and recommend countermeasures for particular safety concerns,” says Cal Coplai, product owner of Ford Mobility’s Safety Insights.

In a separate announcement, StreetLight’s data analysis has revealed that Covid-19 has changed traffic patterns in the US, shifting the morning rush hour in particular. 

Instead of the typical sharp increase in morning travel, followed by a drop and then an afternoon peak, the vehicle miles travelled (VMT) analysis shows weekday traffic building gradually toward a more sustained afternoon high.

In cities there are still ‘peak PM’ commutes – but the peaks are less pronounced.

Washington, DC, now has a slightly earlier peak for PM travel than during the same period in 2019, while Los Angeles and San Francisco have a “mini rush hour” just after lunch.

PM congestion begins earlier - but ends sooner – and there is more vehicle travel around midday than was the case last year.

For more information on companies in this article

Related Content

  • Big data analytics identifies congestion increases
    November 26, 2014
    Iteris has completed and published the Alameda County Transportation Commission (Alameda CTC) 2014 Level of Service Monitoring Report. The report was generated for speed-based congestion monitoring, utilising big data analytics in place of conventional in-field manual data collection for 205 miles of the 327 mile network. Use of big data analytics will be expanded in future monitoring cycles. Many agencies conduct congestion monitoring through manual data collection efforts. Agencies traditionally us
  • How ITS helped Coachella get its groove back
    November 15, 2024
    California’s Coachella Valley attracts visitors to myriad music and sports events. But now an ambitious traffic management initiative aims to cut travel times and reduce emissions. Adam Hill talks to the engineers involved in the massive CV Sync project
  • TEXpress adds reversible managed lanes
    April 19, 2017
    Land availability restrictions and tidal traffic flows have led to the implementation of a novel managed lane configuration in Texas, as Colin Sowman finds out. Dealing with traffic congestion related to the ‘tidal flows’ caused by large numbers of commuters making their way into major business hubs in the morning and returning to the suburbs in the evening, has seen the widespread use of adaptive signal timing and even reversible lanes.
  • Mohamed Mezghani, UITP: “Neither cars nor public transport can satisfy mobility needs separately"
    February 23, 2024
    Mohamed Mezghani of UITP tells Adam Hill how you can create your own bubble on public transport, why riding a tram gives you a new perspective – and how regulation is like a French pastry