Coronavirus cuts US congestion, says Inrix

Coronavirus may have thrown transit systems worldwide into disarray, but new data shows the pandemic has alleviated congestion in the US.
By Ben Spencer April 1, 2020 Read time: 1 min
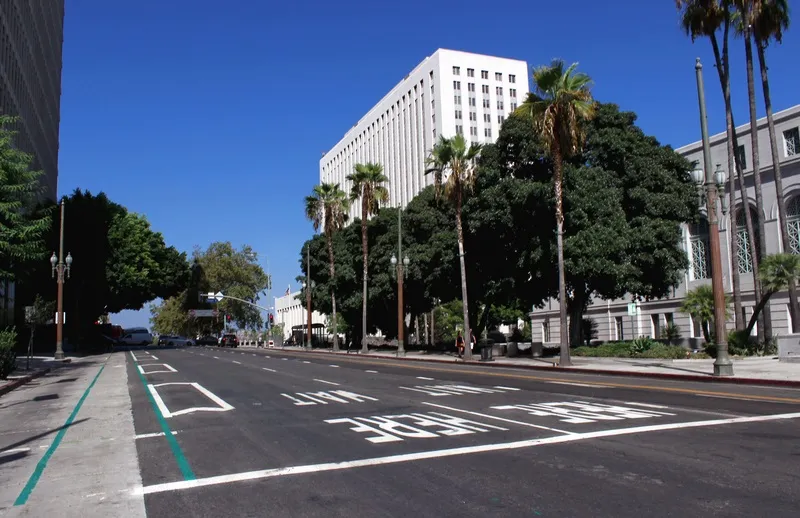
LA's streets are a little emptier than usual (© Veressskun | Dreamstime.com)

In just one week (13-20 March), reduced congestion in 25 of the largest metropolitan areas moved to free-flow traffic, says Inrix.
 
The company found travel speeds increased in Los Angeles from 9% (8am) and 38% (5.30pm) on 13 March to 43% (8am) and 75% (5.30pm) on 20 March.
 
During the same period, Chicago's travel speeds jumped from 8% (8am) and 35% (5.30pm) to 44% (8am) and 74% (5.30pm).

In Phoenix, drivers travelled slightly slower in the morning based on a drop from 20% to 19% but experienced better conditions in the evening with speeds climbing up from 19% to 60%.
 
This upward curve also took place in Miami with travel speeds increasing from 11% to 27% in the morning and going up 25% to 57% in the evening. Drivers travelled more quickly through San Francisco with speeds picking up 17% to 27% (8am) and 29% to 55% at (5.30pm).


For more information on companies in this article

Related Content

  • London tops global congestion ranking, says report
    March 15, 2016
    The Inrix Traffic Scorecard 2015, which measures progress in improving urban mobility, reveals strong economic growth and record population levels resulting in London becoming the first city to surpass 100 hours wasted per driver in gridlock. The report analysed traffic congestion in more than 100 cities worldwide. London topped the list, with drivers wasting an average of 101 hours, or more than four days, in gridlock in 2015. Across the UK, drivers spent 30 hours on average in delays last year, consist
  • Oh dear - and micromobility had been going so well…
    October 7, 2020
    Rides on scooters and bikes in 2019 were up 60% on 2018 - but they plummeted after March
  • Real-time driving data reveals rush hour congestion on London’s road during tube strike
    February 6, 2017
    Following the warning by London Underground chiefs of tube strikes until lunchtime Wednesday 8 February, Waze, the real-time crowd-sourced sat nav app, issued data collected during the strike on 9 January to show, for the first time, just how badly London's commuters are affected by strike action. According to Waze, on 9th January, data at the peak-time 8.05am showed that 24 per cent of traffic was bumper to bumper– effectively standstill; at this time on a normal day it is usually around 12 per cent. Th
  • Inrix identifies the worst traffic hotspots in the 25 most congested US cities
    September 28, 2017
    Inrix has published its latest research on the worst traffic hotspots in America. Using Inrix Roadway Analytics, a cloud-based traffic analysis tool, Inrix analysed and ranked more than 100,000 traffic hotspots in the 25 most congested US cities. The economic cost of hotspots was also calculated in terms of wasted time, lost fuel and carbon emissions over the next decade. The research identified and ranked 108,000 traffic hotspots in the 25 most congested cities in the US identified by the INRIX Global T