Researchers at the Texas A&M Transportation Institute (TTI) have come up with a way to measure the unreliability of trip times due to traffic congestion. The Planning Time Index (PTI) illustrates the amount of extra time needed to arrive on time for higher priority events, such as an airline departure, just-in-time shipments, medical appointments or especially important social commitments. If the PTI for a particular trip is 3.00, a traveller would allow sixty minutes for a trip that typically takes twenty
Researchers at the Texas A&M Transportation Institute (TTI) have come up with a way to measure the unreliability of trip times due to traffic congestion.
The Planning Time Index (PTI) illustrates the amount of extra time needed to arrive on time for higher priority events, such as an airline departure, just-in-time shipments, medical appointments or especially important social commitments. If the PTI for a particular trip is 3.00, a traveller would allow sixty minutes for a trip that typically takes twenty minutes when few cars are on the road. Allowing for a PTI of 3.00 would ensure on-time arrival 19 out of 20 times.
PTIs on freeways vary widely across the nation, from 1.31 (about nine extra minutes for a trip that takes 30 minutes in light traffic) in Pensacola, Florida, to 5.72 (almost three hours for that same half-hour trip) in Washington, DC, according to the 2012 Urban Mobility Report (UMR) by TTI, prepared in partnership with travel time information provider163 Inrix.
“We all understand that trips take longer in rush hour, but for really important appointments, we have to allow increasingly more time to ensure an on-time arrival,” says Bill Eisele, a TTI researcher and report co-author. “As bad as traffic jams are, it’s even more frustrating that you can’t depend on traffic jams being consistent from day-to-day. This unreliable travel is costly for commuters and truck drivers moving goods.”
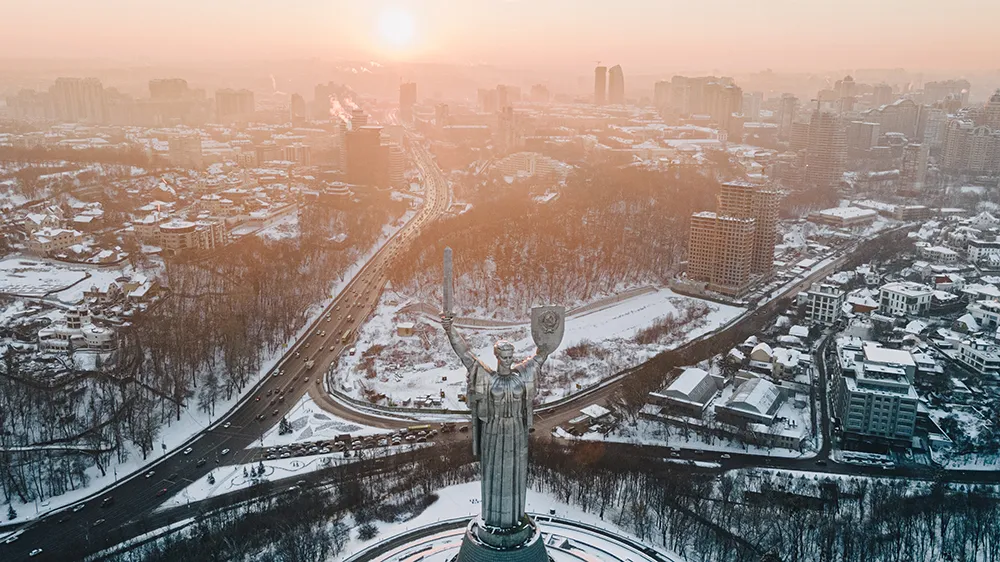
Rankings of the nation’s most congested cities vary slightly from year to year, and many of this year’s top 10 are repeat performers. Washington, D.C. tops the list, followed by Los Angeles, San Francisco-Oakland, New York-Newark and Boston. The second five include Houston, Atlanta, Chicago, Philadelphia and Seattle. The report provides a detailed illustration of traffic problems in a total of 498 US urban areas.
In addition to PTI, the 2012 UMR also debuts an estimate of the additional carbon dioxide (CO2) emissions attributed to traffic congestion: 56 billion pounds – about 380 pounds per auto commuter.
“Including CO2 emissions into the UMR provides another dimension to the urban congestion problem,” says researcher and co-author David Schrank. “It points to the importance of implementing transportation improvements to reduce congestion.” The analysis of CO2 was made possible by funding from the National Center for Freight and Infrastructure Research and Education (CFIRE).
Traffic congestion in US cities has remained relatively stable in recent years and continues to underscore the link between traffic and the economy, according to the UMR. As the nation’s job picture has slowly improved, some congestion measures in 2011 were generally comparable to the year before.
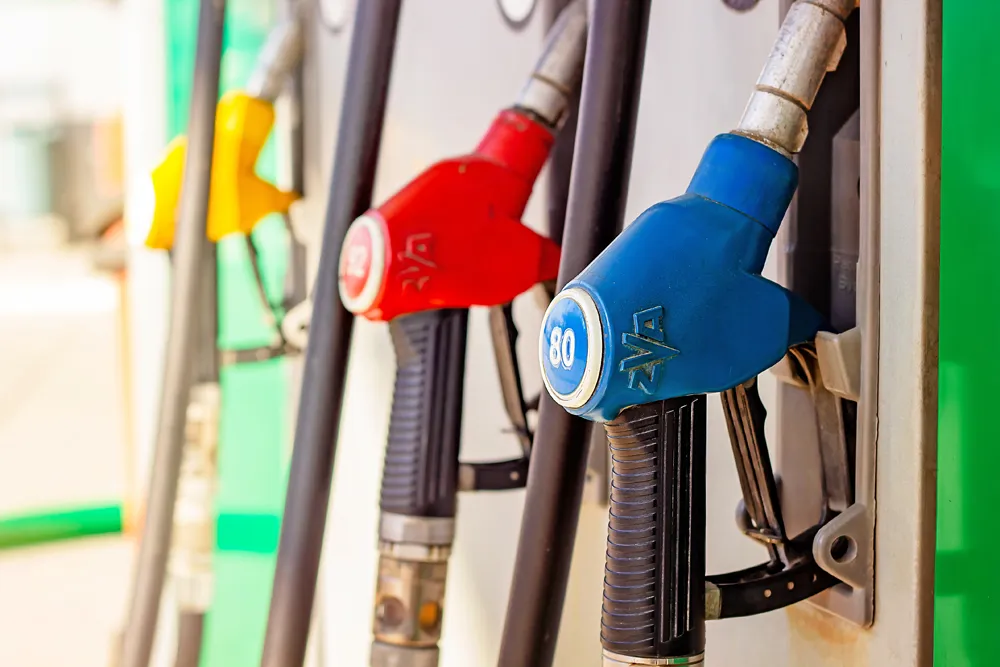
Fuel wasted in congested traffic reached a total of 2.9 billion gallons – enough to fill the New Orleans Superdome four times. That’s the same as 2010, but short of the 3.2 billion gallons wasted in 2005. The Travel Time Index (the difference in time required for a rush hour commute compared to the same trip in non-congested conditions) remained steady at 1.18, still short of the 1.23 level in 2005.
The total financial cost of congestion in 2011 was US$121 billion, up one billion dollars from the year before and translating to US$818 per US commuter. Of that total, about US$27 billion worth was wasted time and diesel fuel from trucks moving goods on the system.
The methods and measures developed by TTI and used in the Urban Mobility Report have been successfully implemented for policy making and prioritizing congestion-mitigating projects,” says report co-author and researcher Tim Lomax. “In light of the recent signing of the Moving Ahead for Progress in the 21st Century (MAP-21) Act, there is greater importance on using such measures to prioritise transportation improvement spending to get the highest investment return for the public.”
Researchers say that the most effective way to address traffic congestion varies from one urban area to another, but that in all cases a multi-faceted approach should be used, relying on more efficient traffic management and public transportation in addition to new construction. Travel options such as flexible work hours and telecommuting should also be part of the mix.
The Planning Time Index (PTI) illustrates the amount of extra time needed to arrive on time for higher priority events, such as an airline departure, just-in-time shipments, medical appointments or especially important social commitments. If the PTI for a particular trip is 3.00, a traveller would allow sixty minutes for a trip that typically takes twenty minutes when few cars are on the road. Allowing for a PTI of 3.00 would ensure on-time arrival 19 out of 20 times.
PTIs on freeways vary widely across the nation, from 1.31 (about nine extra minutes for a trip that takes 30 minutes in light traffic) in Pensacola, Florida, to 5.72 (almost three hours for that same half-hour trip) in Washington, DC, according to the 2012 Urban Mobility Report (UMR) by TTI, prepared in partnership with travel time information provider
“We all understand that trips take longer in rush hour, but for really important appointments, we have to allow increasingly more time to ensure an on-time arrival,” says Bill Eisele, a TTI researcher and report co-author. “As bad as traffic jams are, it’s even more frustrating that you can’t depend on traffic jams being consistent from day-to-day. This unreliable travel is costly for commuters and truck drivers moving goods.”
Rankings of the nation’s most congested cities vary slightly from year to year, and many of this year’s top 10 are repeat performers. Washington, D.C. tops the list, followed by Los Angeles, San Francisco-Oakland, New York-Newark and Boston. The second five include Houston, Atlanta, Chicago, Philadelphia and Seattle. The report provides a detailed illustration of traffic problems in a total of 498 US urban areas.
In addition to PTI, the 2012 UMR also debuts an estimate of the additional carbon dioxide (CO2) emissions attributed to traffic congestion: 56 billion pounds – about 380 pounds per auto commuter.
“Including CO2 emissions into the UMR provides another dimension to the urban congestion problem,” says researcher and co-author David Schrank. “It points to the importance of implementing transportation improvements to reduce congestion.” The analysis of CO2 was made possible by funding from the National Center for Freight and Infrastructure Research and Education (CFIRE).
Traffic congestion in US cities has remained relatively stable in recent years and continues to underscore the link between traffic and the economy, according to the UMR. As the nation’s job picture has slowly improved, some congestion measures in 2011 were generally comparable to the year before.
Fuel wasted in congested traffic reached a total of 2.9 billion gallons – enough to fill the New Orleans Superdome four times. That’s the same as 2010, but short of the 3.2 billion gallons wasted in 2005. The Travel Time Index (the difference in time required for a rush hour commute compared to the same trip in non-congested conditions) remained steady at 1.18, still short of the 1.23 level in 2005.
The total financial cost of congestion in 2011 was US$121 billion, up one billion dollars from the year before and translating to US$818 per US commuter. Of that total, about US$27 billion worth was wasted time and diesel fuel from trucks moving goods on the system.
The methods and measures developed by TTI and used in the Urban Mobility Report have been successfully implemented for policy making and prioritizing congestion-mitigating projects,” says report co-author and researcher Tim Lomax. “In light of the recent signing of the Moving Ahead for Progress in the 21st Century (MAP-21) Act, there is greater importance on using such measures to prioritise transportation improvement spending to get the highest investment return for the public.”
Researchers say that the most effective way to address traffic congestion varies from one urban area to another, but that in all cases a multi-faceted approach should be used, relying on more efficient traffic management and public transportation in addition to new construction. Travel options such as flexible work hours and telecommuting should also be part of the mix.