
PTV releases urban mobility analysis tool

PTV Group has released a data analysis tool which it says will help planners to better understand how transport works in their city.
By Adam Hill May 1, 2020 Read time: 1 min
The PTV solution allows planners to visualise mobility use (© Ded Mityay | Dreamstime.com)

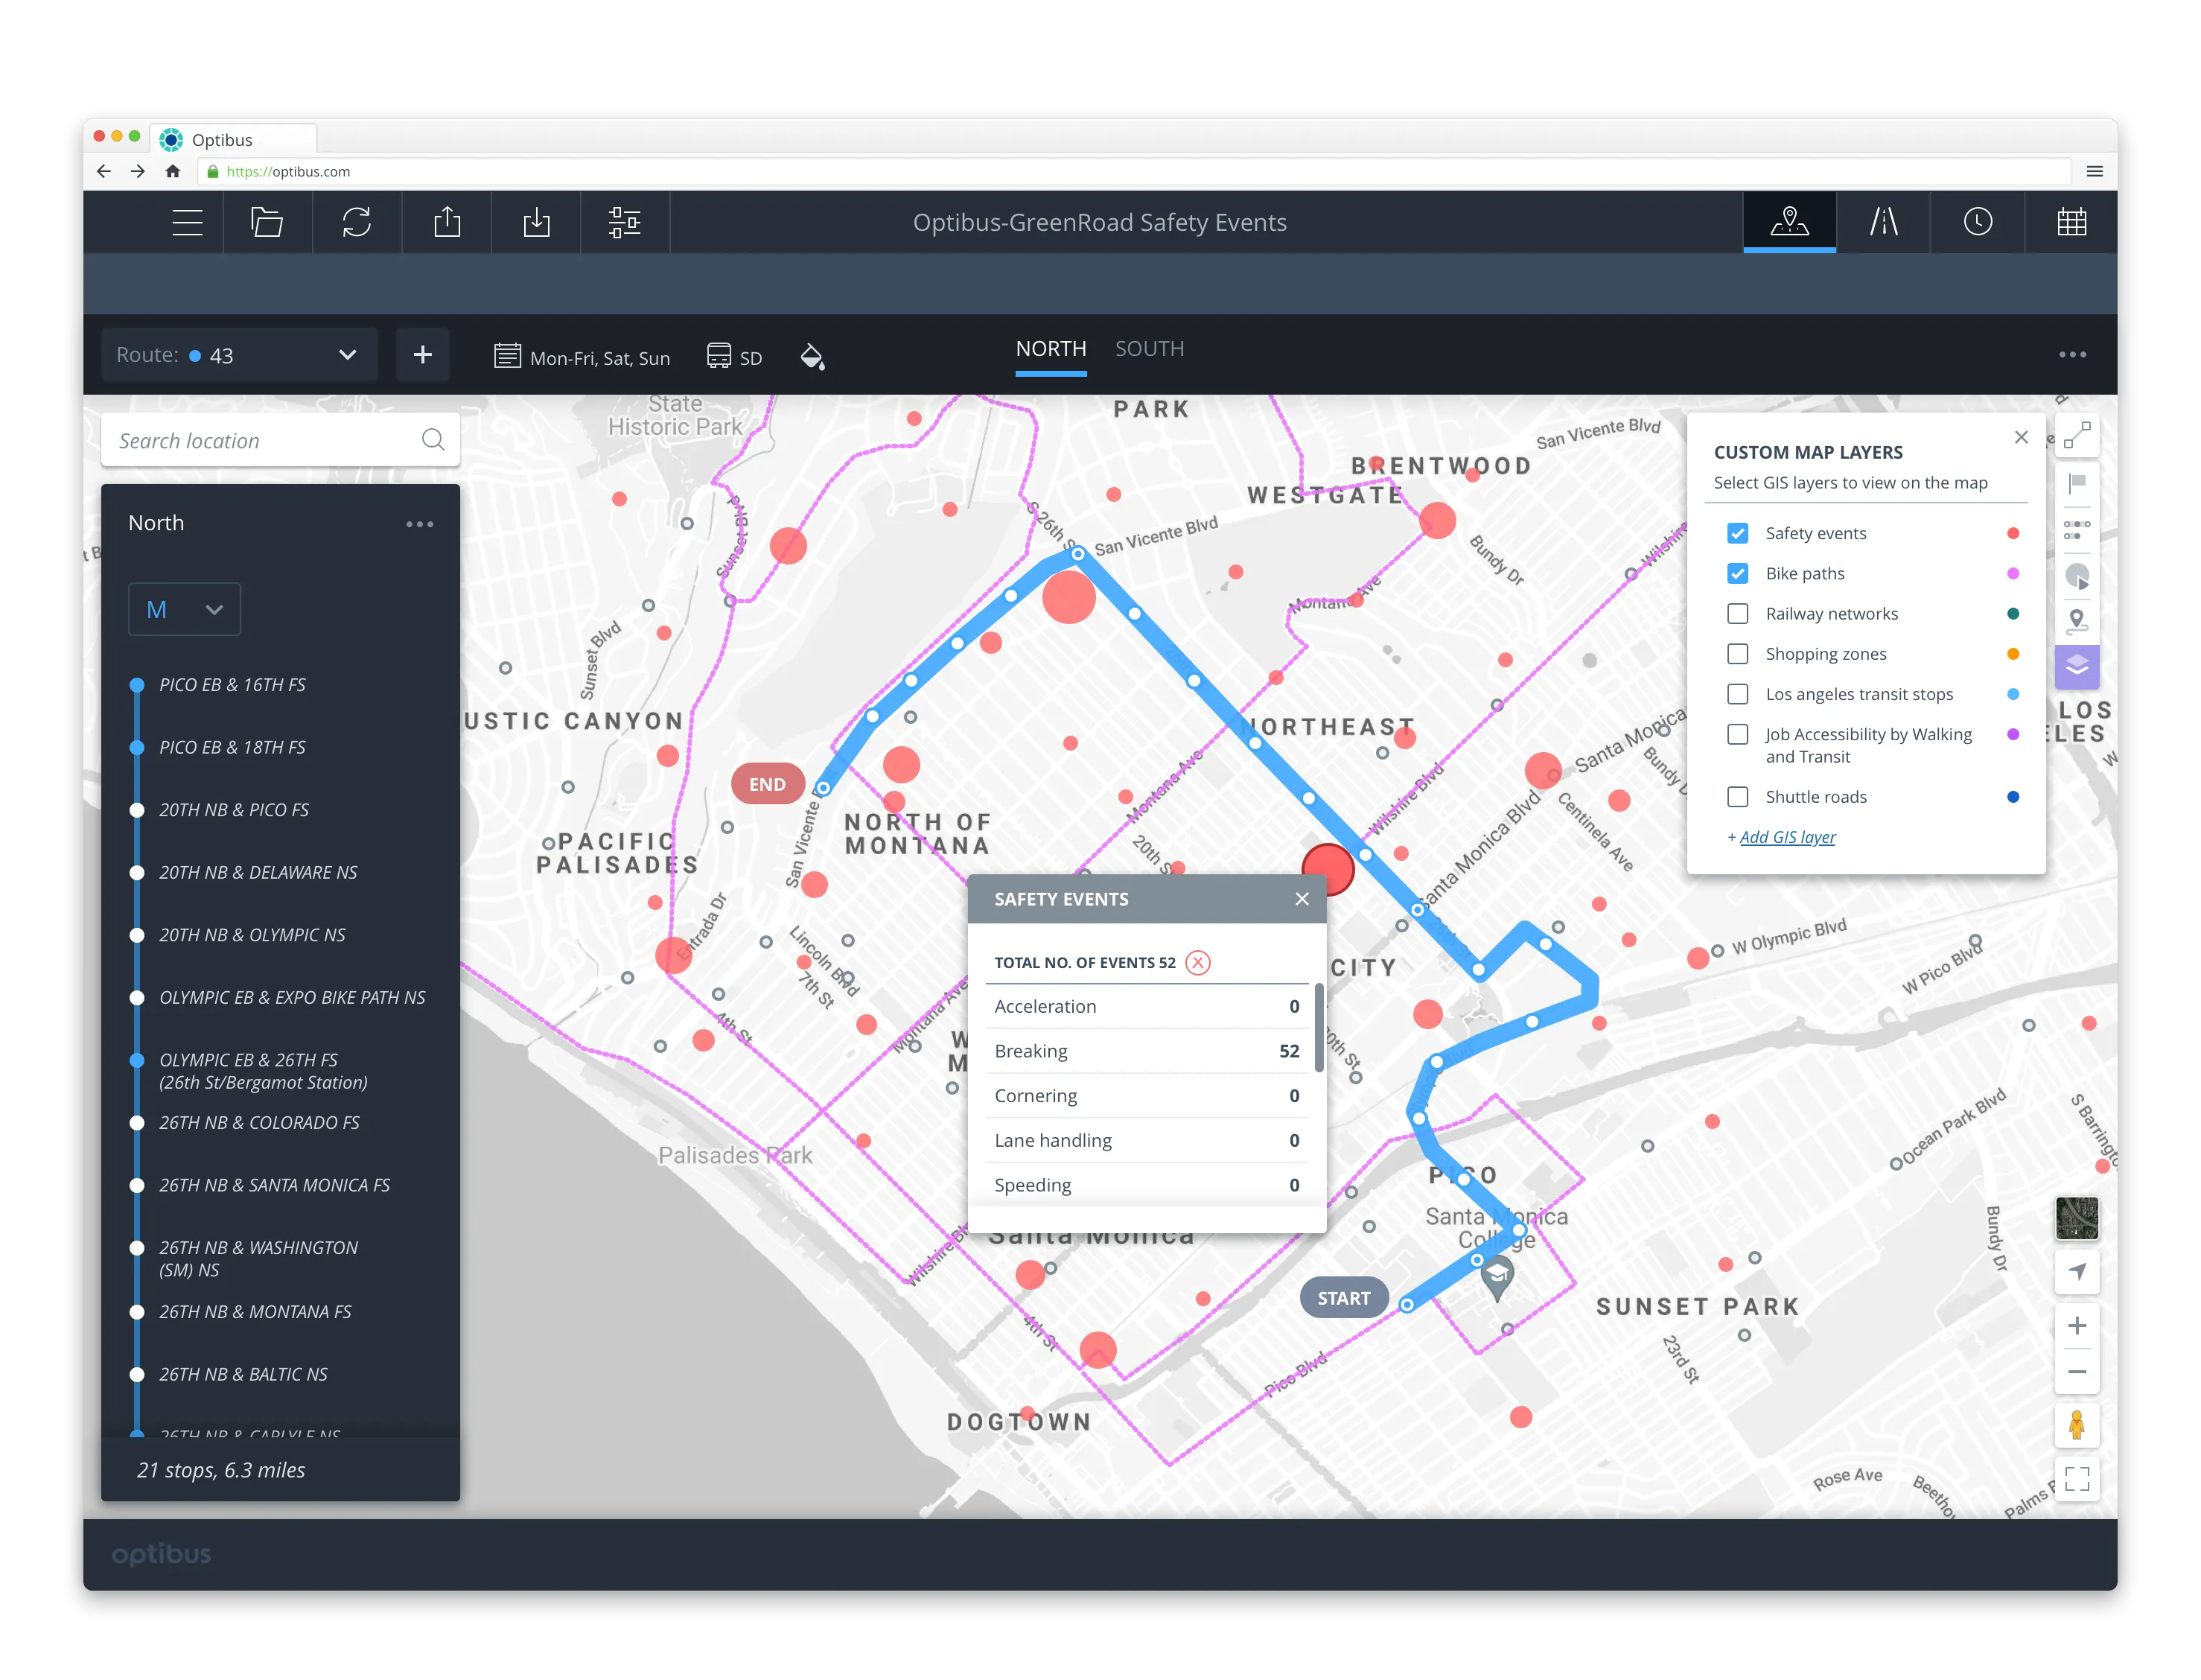
Different kind of questions and scenarios can be evaluated using City in Motion, PTV says, with relevant mobility parameters visualised on digital maps. 

For instance, heat maps can show traffic volume across an entire route network, while an illustration of trip numbers highlights shared mobility options, with parking availability and e-scooter locations.

It also shows how travel demand fluctuates at different times of day or in different areas.

PTV says that policymakers can easily model the effect of interventions such as clear-air zones, parking restritions or street closures, thus allowing them to better plan.

The solution uses artificial intelligence and historical data to forecast transport demand.

“Data-driven analysis and visualisation provide the transparency to identify mobility problems and develop appropriate measures,” says PTV CEO Christian Haas. 

“This is a strong tool that will support city initiatives on their way to a smart and sustainable mobility of the future.”

For more information on companies in this article

Related Content

  • The benefits of Lidar
    March 21, 2022

    While Lidar is gaining ground in the ITS industry, it has not yet reached the level of mass adoption where it shows up frequently in requests for proposals (RFPs) from cities and DoTs.

  • Optibus zeroes in on road safety data 
    October 15, 2021
    Planners can re-plan low-scoring routes to avoid hazard areas and increase safety
  • Spin pledges £100,000 to mobility research
    December 3, 2020
    Initial focus is on safety and will include data from Vivacity Labs' AI and IoT sensors 
  • Upgrading New Yorks's traffic signal timings
    February 28, 2013
    The New York City Department of Transportation instituted the Midtown in Motion project to promote multimodal mobility in the Midtown Core of Manhattan, a 110 square block area or “zone” from Second to Sixth Avenue and 42nd to 57th Street. Control extended from 86th Street to 23rd Street, focused on the core zone. MiM provides signal timing changes on two levels: Level 1 control starts from a pre-stored library of timing plans. These are designed offline and are relevant to arterials inside the Midtown stud