MassDoT dashboard reveals Covid impact

Commuters will be able to see data on traffic volumes and safety
By Ben Spencer September 15, 2020 Read time: 2 mins
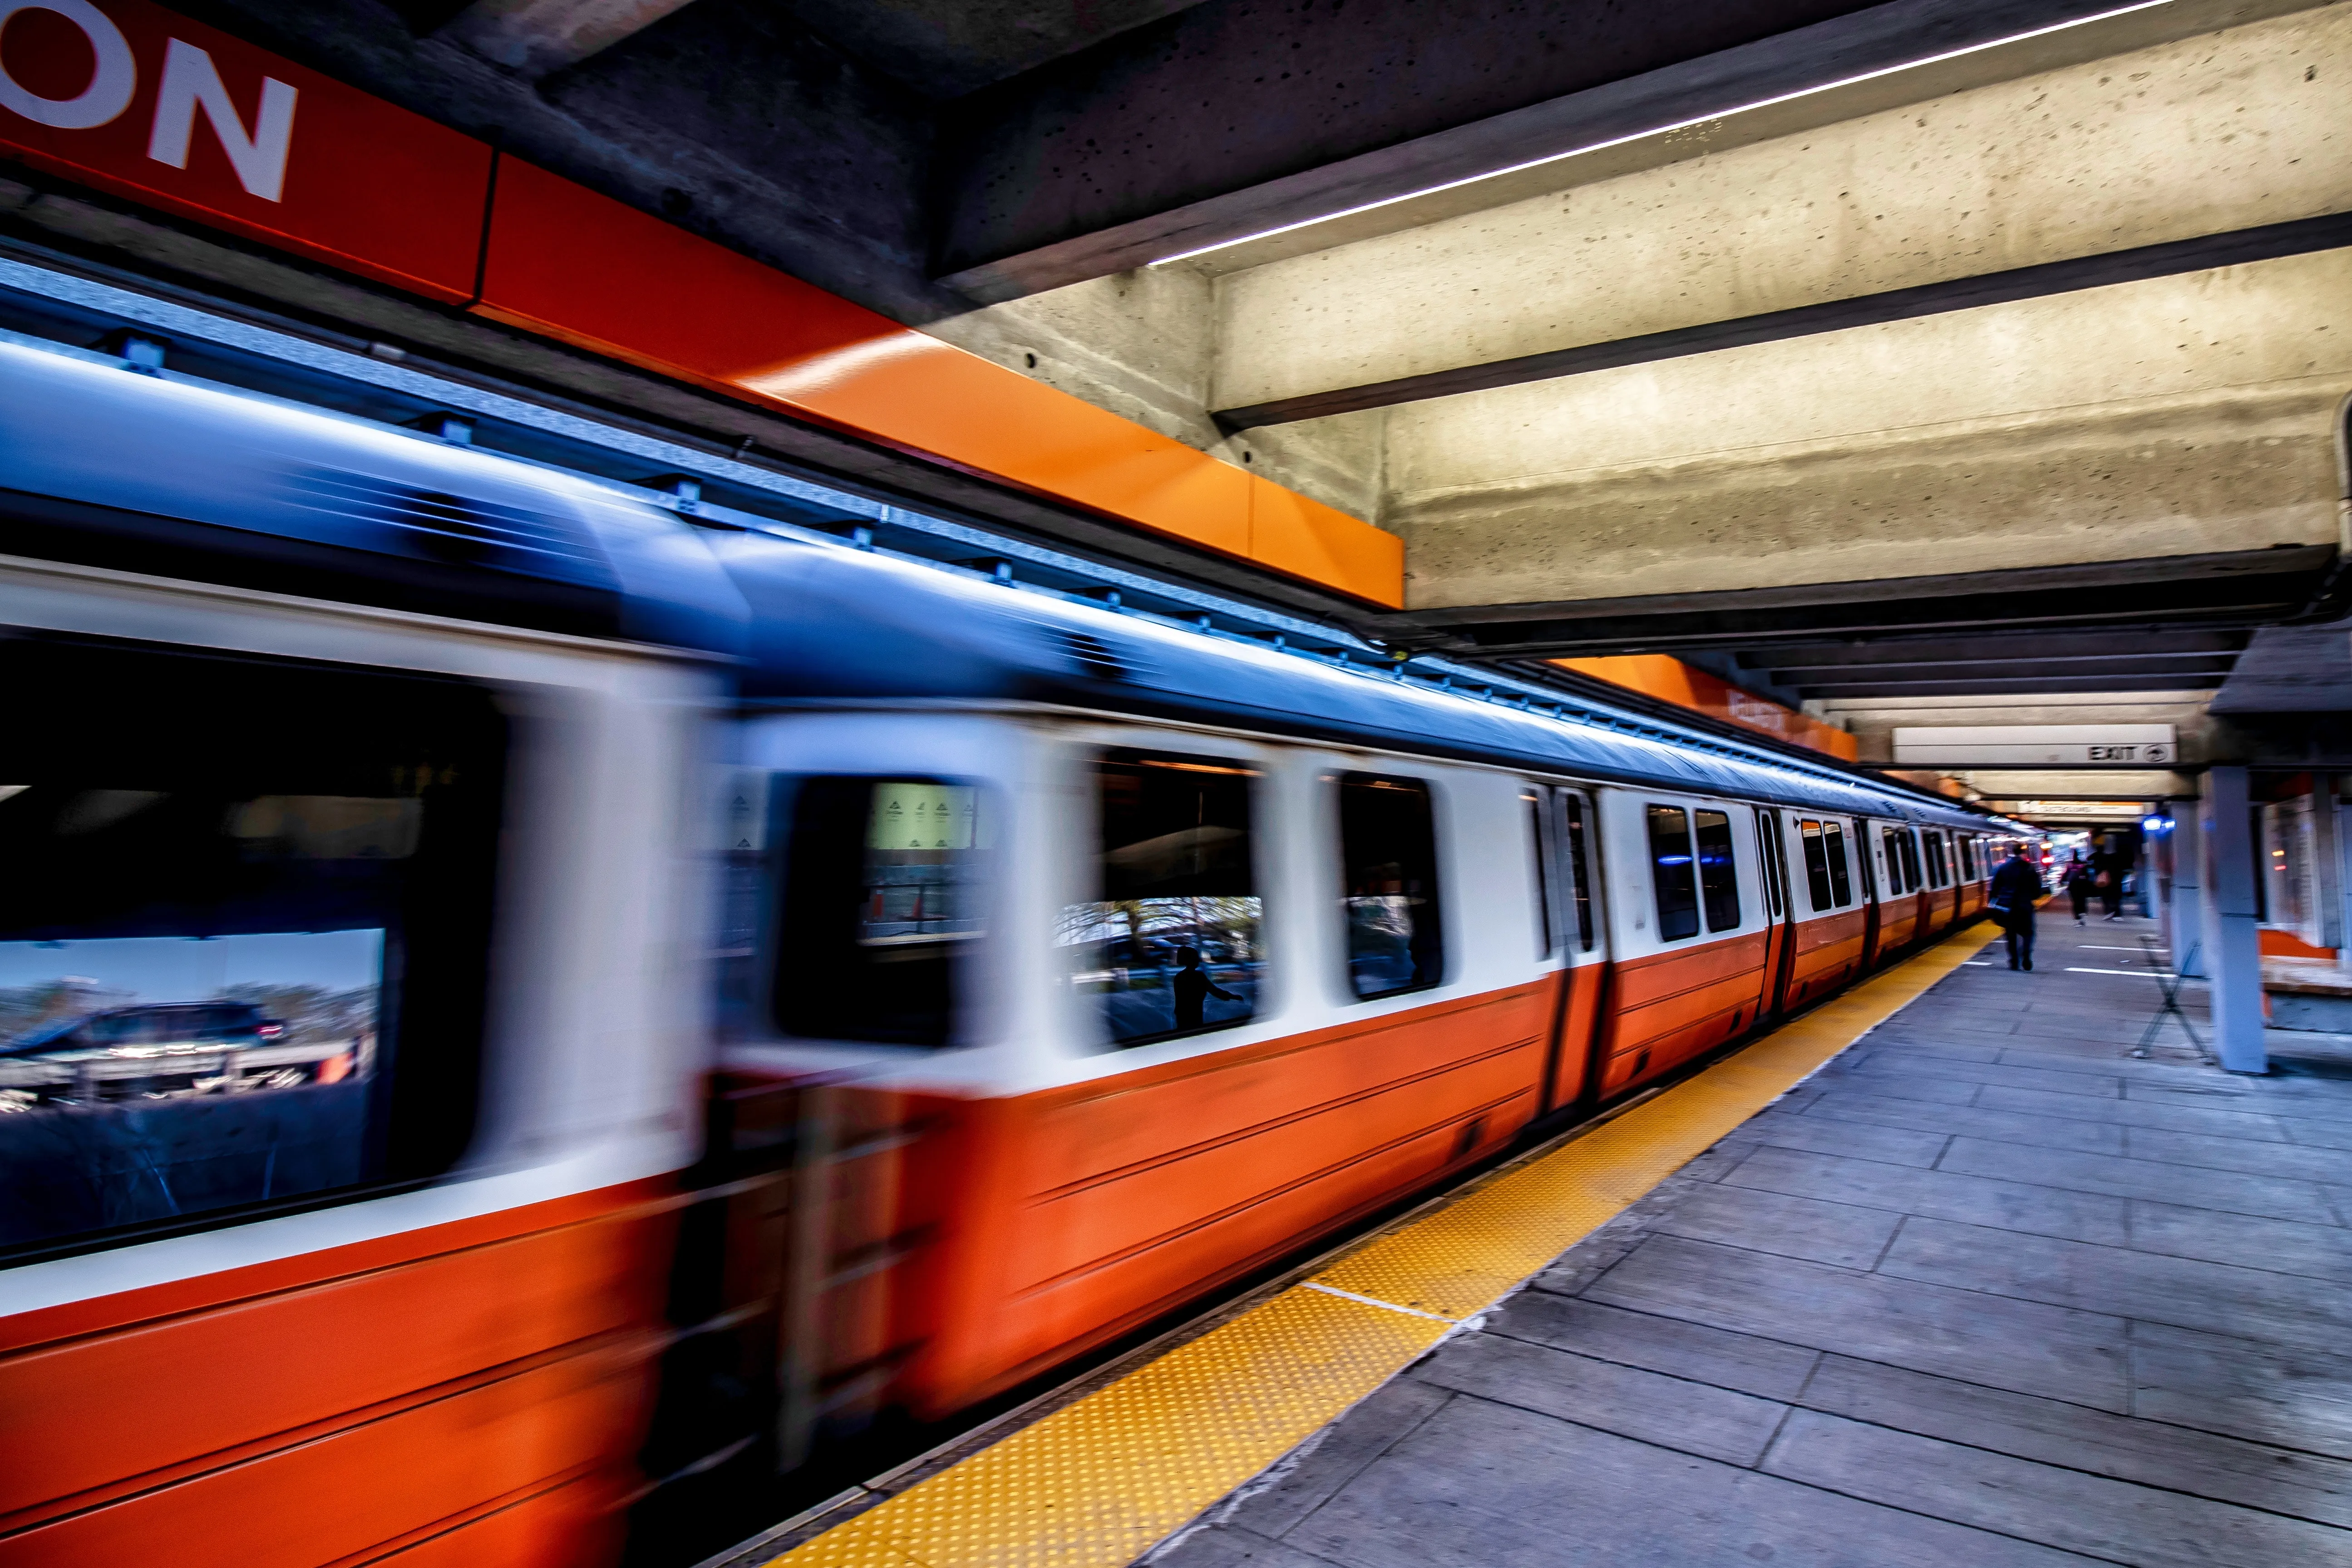
MassDoT dashboard offers insight into pandemic effects on transportation networks (© Alex Rodas | Dreamstime.com)

The Massachusetts Department of Transportation (MassDoT) has released a dashboard that allows commuters to monitor data collected to understand the effects of coronavirus on transportation. 

Stephanie Pollack, CEO at MassDoT, says the MassDoT Mobility Dashboard is one of the ways the department is compiling and monitoring transportation data. 

“Having one central location to access and analyse the impacts of Covid-19 increases public accessibility,” Pollack adds. 

MassDoT says it is continually monitoring the impacts of Covid-19 on roads, transit services and registry transactions.

MassDoT communications manager Klark Jessen describes the dashboard as an interactive round-up of key indicators that reflect how people are travelling. This data is updated weekly with the most recent update displayed at the top of the page, Jessen adds. 

“The MassDoT Mobility Dashboard succinctly organises a variety of multimodal data about movement in the commonwealth that covers a wide range of topics all in one place,” Jessen continues. “Topics include traffic volumes, transit revenue, safety and more.”

Elsewhere in the US, the State of Vermont Agency of Transportation has prepared four data sets that demonstrate changes in transportation data during the Covid-19 response period.

Additionally, the Washington State Department of Transportation has developed a similar dashboard to provide information about the impact pandemic-related closures are having on multimodal transportation.

For more information on companies in this article

Related Content

  • Intertraffic Amsterdam 2024: Smart, safe & sustainable mobility for all
    April 4, 2024
    Intertraffic Amsterdam 2024 is the place where the movers and shakers of the global ITS industry will gather from 16-19 April. With emphasis on climate, artificial intelligence – and even drones – this edition has something for everyone in the transportation sector…
  • IRD wins $4.1m maintenance contract
    August 25, 2021
    IRD to maintain and maximise performance of Illinois’ state-wide weigh in motion network
  • US state of the art workzone safety
    January 25, 2012
    The Texas Transportation Institute's Jerry Ullman talks about the state of the art in work zone safety in the US. Work zones are places where, perhaps more than anywhere else on the road network, mobility and safety are strongly linked. Historically, field crews and contractors wanted vehicles in work zones to be moving as slowly as possible, assuming that made conditions the safest for work crews. We are though starting to see a shift in such thinking with the realisation that excessive delays or slow-down
  • Asking drivers what information they need: radical but effective
    March 19, 2014
    When Texas A&M Transportation Institute was asked to devise a temporary traveller information system for work zones, it started by asking drivers what they need. Robert Brydia explains the thinking, implementation and results. US Interstate 35 (I-35) runs roughly north–south originating in Laredo, Texas and ends 1,500 miles away in Duluth, Minnesota having passed through Oklahoma, Kansas, Missouri and Iowa. Within Texas the I-35 splits into I-35E and I-35W passing through Dallas and Fort Worth respectiv