StreetLight's figures highlight Covid effect

Traffic data provides insights which can be used for planning and BIL investment
By Adam Hill July 15, 2022 Read time: 2 mins
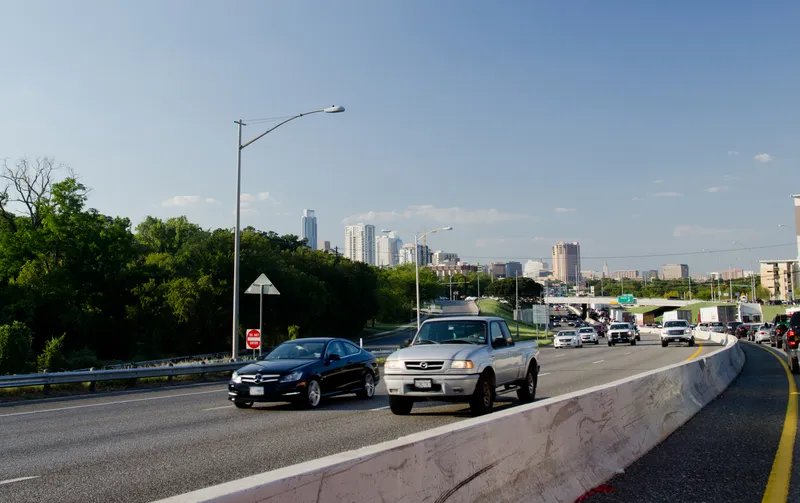
The I-35 corridor in Austin, Texas, has become one of the most congested highways in the state (© Noamfein | Dreamstime.com)

StreetLight Data has released its latest US Annual Average Daily Traffic (AADT) counts for transport planners.

"Validated, comprehensive metrics are essential for planners, consultants and other stakeholders who make important decisions about transportation infrastructure,” said StreetLight CEO Laura Schewel.

The 2021 AADT is based on over 40 billion monthly location records across the country, collected from smartphones, connected cars and trucks.

StreetLight says its algorithms draw on 365 days of data on more than four million miles of roadway and can help in meeting the aims of the Bipartisan Infrastructure Law (BIL) - and in helping agencies with grant applications.

The company measures diverse travel patterns and makes them available on demand via its Software as a Service platform for mobility, StreetLight InSight.

“Traffic volumes are the key input to accurate and detailed transportation greenhouse gas emissions calculations, and having precise measurement is critical in the societal and BIL goal of managing down those emissions," says Schewel.

Providing planning insights is one of the key roles for the figures. For example, the company’s 2021 AADT showed that the I-35 corridor in Austin, Texas, has become one of the most congested highways in the state after a Covid-led relocation boom to the city.

StreetLight studied the I-35 to understand congestion during pre-pandemic days and compared it with trends in 2020 and 2021.

Results showed a high 2019 volume, an expected drop in vehicle trips during the pandemic, with signs of recovery and increasing traffic in 2021. Early trends in 2022 suggest that road traffic will only continue to rise.

The AADT 2021 metrics include updates from the 2020 US Census, enabling traffic studies on almost all road types, including recently-developed roads, providing up-to-date insights.

The company was acquired by Jacobs in February 2022.

Related Content

  • Intertraffic 2022 gets ready for business
    January 27, 2022
    Relaxation of Dutch Covid rules means event at RAI Amsterdam will have 'usual occupancy'
  • US Cities push for smarter poles
    June 25, 2018
    US Cities The need to connect existing infrastructure has led various US transit authorities into imaginative alleyways: David Crawford examines some new roles for street furniture. US cities are vying with each other in developing schemes to create a new generation of connected places. Their strategies include taking advantage of their streetlight poles’ height and ubiquity to give them new roles in supporting intelligent nodes. They are now being equipped for collecting real-time data on key transport
  • LiDAR sets its sights on future problems
    February 23, 2017
    AAdvances in LiDAR are helping transport authorities improve services and identify potential problem areas, as geospatial technology expert Dr Neil Slatcher explains. The effects of climate change on the transport infrastructure have long been a cause of concern within the transportation sector - and not only on the structures themselves but also on the surrounding areas. This year, those concerns have become reality with landslides, structural collapses and surfacing issues impacting services across the wo
  • Cost benefit analysis ‘can’t be carried out with a cookbook’
    June 25, 2018
    There is far more to working out the worth of a project than simply filling in a few headings on a spreadsheet. David Crawford surveys some recent thinking from the US and Canada. Cost benefit analysis (CBA) “can’t be carried out with a cookbook”, warns US analyst Professor Robert J Brent. “ You can’t just get out a spreadsheet and fill in the data for all the headings. Each transport CBA should have something that is distinctive, in terms of location (for example, for a rural area), types of user