StreetLight's figures highlight Covid effect

Traffic data provides insights which can be used for planning and BIL investment
By Adam Hill July 15, 2022 Read time: 2 mins
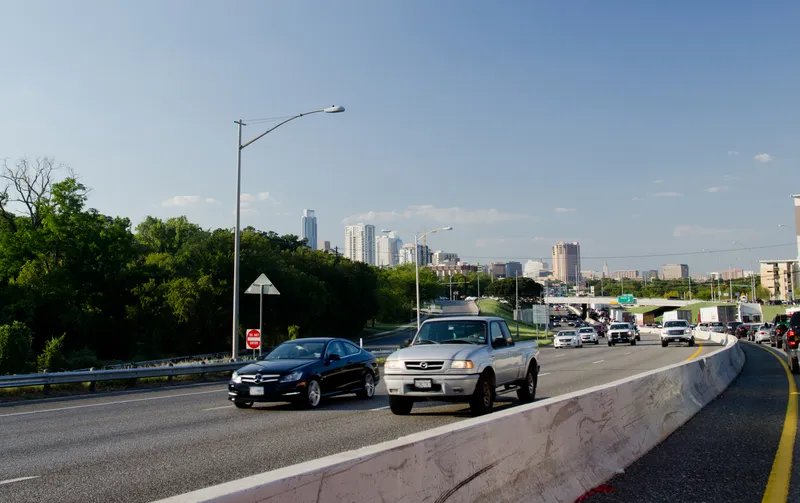
The I-35 corridor in Austin, Texas, has become one of the most congested highways in the state (© Noamfein | Dreamstime.com)

StreetLight Data has released its latest US Annual Average Daily Traffic (AADT) counts for transport planners.

"Validated, comprehensive metrics are essential for planners, consultants and other stakeholders who make important decisions about transportation infrastructure,” said StreetLight CEO Laura Schewel.

The 2021 AADT is based on over 40 billion monthly location records across the country, collected from smartphones, connected cars and trucks.

StreetLight says its algorithms draw on 365 days of data on more than four million miles of roadway and can help in meeting the aims of the Bipartisan Infrastructure Law (BIL) - and in helping agencies with grant applications.

The company measures diverse travel patterns and makes them available on demand via its Software as a Service platform for mobility, StreetLight InSight.

“Traffic volumes are the key input to accurate and detailed transportation greenhouse gas emissions calculations, and having precise measurement is critical in the societal and BIL goal of managing down those emissions," says Schewel.

Providing planning insights is one of the key roles for the figures. For example, the company’s 2021 AADT showed that the I-35 corridor in Austin, Texas, has become one of the most congested highways in the state after a Covid-led relocation boom to the city.

StreetLight studied the I-35 to understand congestion during pre-pandemic days and compared it with trends in 2020 and 2021.

Results showed a high 2019 volume, an expected drop in vehicle trips during the pandemic, with signs of recovery and increasing traffic in 2021. Early trends in 2022 suggest that road traffic will only continue to rise.

The AADT 2021 metrics include updates from the 2020 US Census, enabling traffic studies on almost all road types, including recently-developed roads, providing up-to-date insights.

The company was acquired by Jacobs in February 2022.

Related Content

  • MobilityXX: ‘Women pay more for safe transport’
    October 8, 2021
    Laura Chace, new boss of ITS America, is fully behind the MobilityXX initiative, which promotes the role of women in transportation. She tells Adam Hill why the ’10 by 10’ target is so important…
  • Will volatile fuel prices increase use of public transport? Or not?
    May 16, 2012
    A day after ITS International published details of a report from The Mobility Collaborative - $4 per gallon gas won't alter driving behaviour, claims national study - the American Public Transportation Association (APTA) and Building America's Future (BAF) has released a study which draws the opposite conclusion and predicts that record numbers of Americans will turn to public transportation as a cost-cutting measure in the face of volatile gas prices.
  • Smoothing out city freight movements
    May 28, 2014
    David Crawford welcomes a national first. Urban freight movements, while commercially and socially vital, are a growing logistical headache for planners and people alike. Figures from France’s Lyon Laboratory of Transport Economics indicate that goods transport in major urban areas accounts for: 20% of traffic; 35% of CO2 emissions made by all urban trips; and 50% of the diesel used; while final km delivery runs account for 20% of the total cost of the transport chain.
  • StreetLight Data launches solution to combat traffic jams
    May 11, 2018
    Mobility analytics company StreetLight Data has released its Traffic Diagnostics tool to help transportation planners diagnose the cause of traffic jams and identify solutions. The product is available to new and existing clients in the US. Streetlight Data says the platform compares thousands of traffic jams in minutes and helps planners save money by ensuring that infrastructure is put in the right place. In addition, users can create visualisations that tell the story of traffic jams to stakeholders.