StreetLight's figures highlight Covid effect

Traffic data provides insights which can be used for planning and BIL investment
By Adam Hill July 15, 2022 Read time: 2 mins
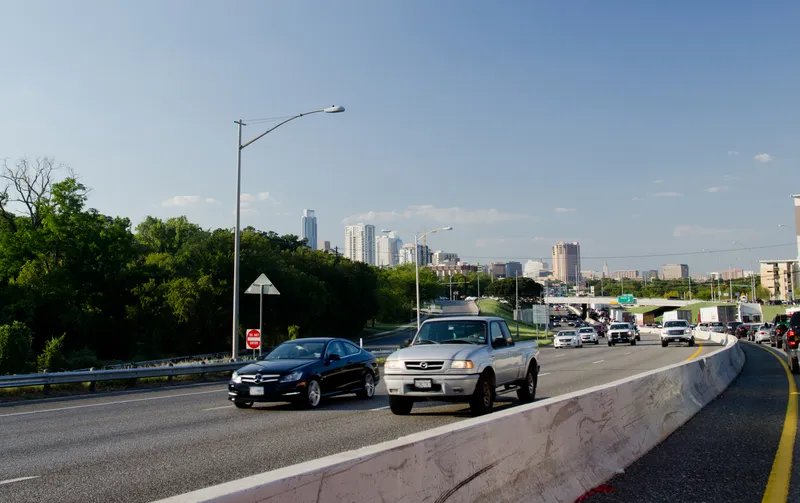
The I-35 corridor in Austin, Texas, has become one of the most congested highways in the state (© Noamfein | Dreamstime.com)

StreetLight Data has released its latest US Annual Average Daily Traffic (AADT) counts for transport planners.

"Validated, comprehensive metrics are essential for planners, consultants and other stakeholders who make important decisions about transportation infrastructure,” said StreetLight CEO Laura Schewel.

The 2021 AADT is based on over 40 billion monthly location records across the country, collected from smartphones, connected cars and trucks.

StreetLight says its algorithms draw on 365 days of data on more than four million miles of roadway and can help in meeting the aims of the Bipartisan Infrastructure Law (BIL) - and in helping agencies with grant applications.

The company measures diverse travel patterns and makes them available on demand via its Software as a Service platform for mobility, StreetLight InSight.

“Traffic volumes are the key input to accurate and detailed transportation greenhouse gas emissions calculations, and having precise measurement is critical in the societal and BIL goal of managing down those emissions," says Schewel.

Providing planning insights is one of the key roles for the figures. For example, the company’s 2021 AADT showed that the I-35 corridor in Austin, Texas, has become one of the most congested highways in the state after a Covid-led relocation boom to the city.

StreetLight studied the I-35 to understand congestion during pre-pandemic days and compared it with trends in 2020 and 2021.

Results showed a high 2019 volume, an expected drop in vehicle trips during the pandemic, with signs of recovery and increasing traffic in 2021. Early trends in 2022 suggest that road traffic will only continue to rise.

The AADT 2021 metrics include updates from the 2020 US Census, enabling traffic studies on almost all road types, including recently-developed roads, providing up-to-date insights.

The company was acquired by Jacobs in February 2022.

Related Content

  • Cost benefit: Wichita eases workzone congestion
    July 8, 2019
    Achieving higher diversion rates has helped one Kansas city to make traffic flow more efficient around workzones. David Crawford examines what’s behind a 10:1 benefit-to-cost ratio in Wichita Around 10% of highway congestion in the US results from delays in workzones, leading to an estimated annual loss of $700 million in fuel costs alone. The lack of accessible real-time traffic information to help motorists minimise their inconvenience – particularly at peak times - is a major contributor. One solut
  • US congestion costs continue to rise
    January 25, 2012
    The 2010 Urban Mobility Report, published by the Texas Transportation Institute at Texas A&M University, concludes that after two years of slight declines in overall traffic congestion - attributable to the economic downturn and high fuel prices - leading indicators suggest that as the economy rebounds, traffic problems are doing the same. While 2008 was the best year for commuters in at least a decade, the problem again began to grow in 2009.
  • Covid turns tolls cashless
    December 23, 2021
    When coronavirus hit, Pennsylvania Turnpike Commission made its long-planned e-tolling system permanent; this made sense, but it was still a difficult decision, explains the organisation’s Carl DeFebo
  • Deaths of US pedestrians rise sharply, says GHSA report
    April 2, 2019
    Pedestrian deaths across the US have risen to their highest number in nearly 30 years. Many factors are responsible - including the rise and rise of SUVs - according to a worrying new GHSA report ore pedestrians died on US roads last year than in any year since 1990. The Governors Highway Safety Association (GHSA) suggests that 6,227 pedestrians were killed in 2018 – a 4% increase on 2017. Pedestrian deaths as a percentage of total motor vehicle crash deaths increased from 12% in 2008 to 16% in 2017, whi