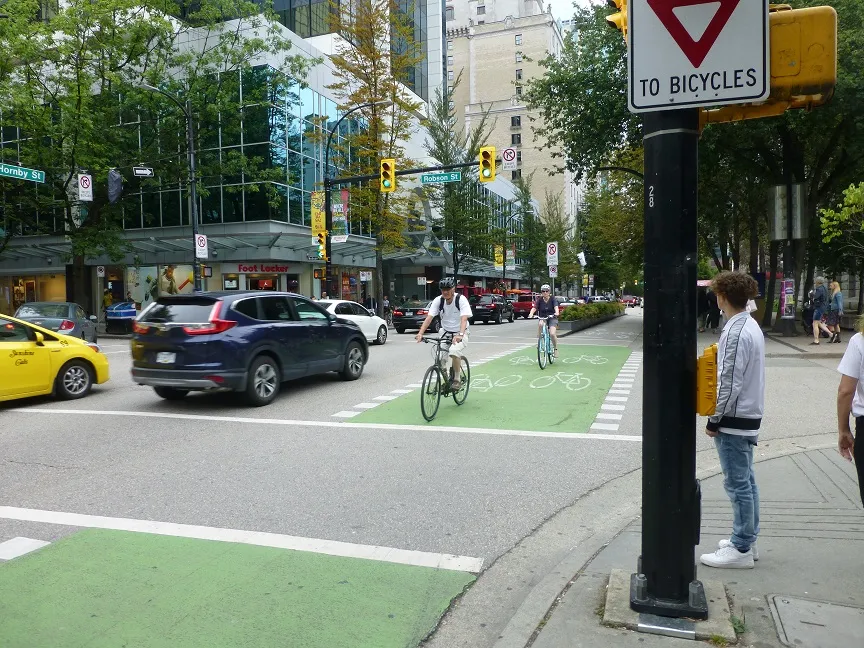
StreetLight Data offers dashboard of bike and pedestrian metrics

StreetLight Data has unveiled a tier of its InSight software which it says offers metrics to help transportation planners improve bike, scooter and pedestrian infrastructure.
October 24, 2019 Read time: 1 min

StreeLight Data claims its ‘Bike and Pedestrian Essentials’ will help communities better understand transportation usage, safety and priorities for bike lanes and other infrastructure.

Sean Co, StreetLight’s director of special projects, says San Francisco has 75 bicycle sensors which “only offer a partial perspective on bike traffic” but the company’s virtual sensors “cover nearly every city block”.

He insists that overlaying collision counts with StreetLight’s Activity Index across an entire city allows transportation agencies to pinpoint bicycle collision rates and prioritise where to act first.

“From 2015 to 2018, San Francisco saw over 1,400 bike injuries and fatal collisions,” he continues. “However, as StreetLight’s bike activity overlay reveals, transportation agency safety initiatives can be focused on a subset of roads with the highest exposure (where both bike traffic and collision rates are highest).”

The software tier will also provide metrics to help transportation professionals assess trip volume between and within zones to identify demand as well as travel distance and speed to address first- and last-mile connections, the company adds. 

For more information on companies in this article

Related Content

  • Deriving data to tackle tribal road crashes
    June 14, 2017
    David Crawford looks at a new initiative to deal with high crash and fatality rates on America’s tribal roads. According to the US Centres for Disease Control and Prevention, on average two members of the country’s indigenous communities - American Indians or Alaskan Natives (AI/AN) - die every day in motor vehicle crashes. This represents a far higher percentage than that of the country’s general population. Historically, the US states with the worst records are Wyoming, South Dakota, Montana, North Dakot
  • VRU safety report urges enforcement
    March 18, 2020
    Enforcement must be at the heart of a drive to reduce vulnerable road user deaths and injuries, says the latest report from the European Transport Safety Council. Its facts and figures give authorities the justification to invest more in camera technology and other ITS solutions
  • Bronx benefits from mesoscopic-microscopic modelling
    January 7, 2014
    Michael Marsico, Andrew Weeks, Keir Opie and Murat Ayçin explain the application of hybrid traffic simulation to a planning study in New York City. Traffic modelling, particularly mesoscopic-microscopic hybrid simulation, has played a key role in planning for the future of one of America's shortest interstates, the 1.3-mile Sheridan Expressway. New York City has just completed a two-year, interagency study federally funded by a TIGER II grant on how to improve the Sheridan Expressway and its surroundi
  • Standardise micromobility KPIs, urges Ramboll report
    April 23, 2020
    Transportation consultancy Ramboll is urging cities to adopt standardised key performance indicators (KPIs) when attempting to integrate micromobility into their transportation networks.