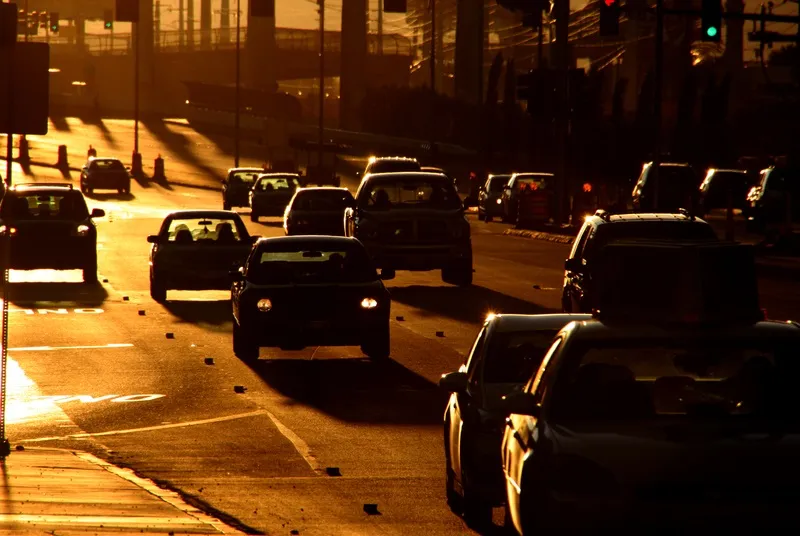
People in the US are getting into their cars a lockdowns are eased and hitting the road once more, despite worries about coronavirus infection.
From the beginning of March until 7 April, the national average drop in vehicle miles travelled was 72%.
Yet while Covid-19 cases are rising in many states, research from StreetLight Data and Boston Consulting Group suggests that VMT in rural counties in the US has now fully recovered to pre-Covid levels, while it is up around 90% in urban counties.
There are numerous regional variations: for instance, the New York, New Jersey and Connecticut tri-state area and Washington DC initially saw drops of 80-90%, while in states such as Texas and Alabama the drops were 50-60%.
“Covid-19 has dramatically increased the need for mobility data analysis to understand travel patterns and modal choices during the different stages of lockdown and reopening,” said Augustin K. Wegscheider, a partner at BCG and leader of the firm’s Center for Mobility Innovation in North America.
In general, urban counties saw a VMT reduction 20-30 percentage points higher on average than that of rural counties.
"The top three correlating factors to the VMT reduction profile are household income, population density, and prevalence of professional service jobs, all of which are higher in urban areas than rural," the companies say.
The recovery in VMT has been steady since Easter Sunday.


