Intelematics releases Australian historic traffic flow data

Intelematics has published historic traffic flow data files for more than 2,000 Australian suburbs from 2016-19.
By Ben Spencer March 13, 2020 Read time: 2 mins
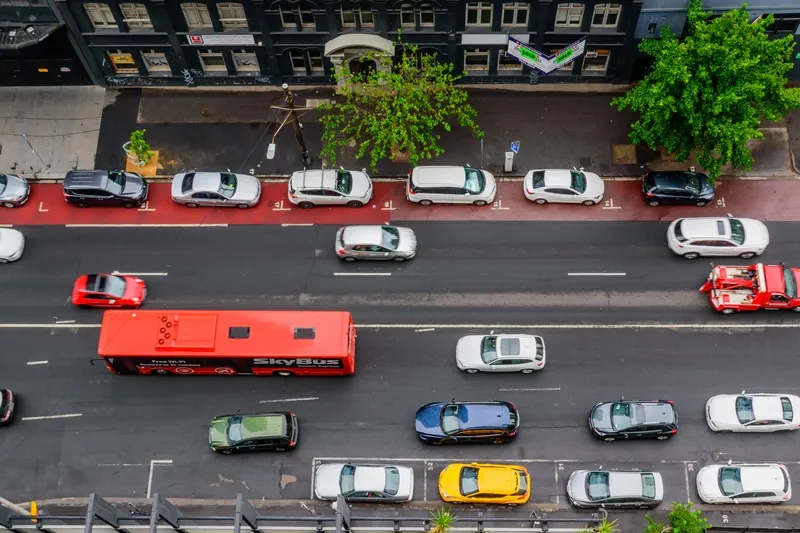
Melbourne streets: Intelematics is going back in time (© Matko Medic | Dreamstime.com)

The company says this will allow traffic management companies and consultants to better understand and plan their projects. 

The use of such data improved afternoon peak hour congestion by 14% on Hoddle Street in Melbourne, the company claims.

John Cardoso, Intelematics’ senior product manager, says it shows traffic flow, speed, speed limits and delays by correlations between suburbs and street names, kilometres per hour, geographic coordinates and time of day.

“The data is available in 15-minute increments. However, if customers need nine-minute, six-minute, or three-minute increments we have that too,” he continues. 

“In addition, each file purchased captures one year’s worth of traffic flow data – many companies only offer three months.”

From April, Intelematics is to roll out traffic data by month consecutively in a move which it says will allow users to access analyse 2020 road and traffic projects without having to wait a full year. 

It will also launch historical traffic volume data files showing vehicle counts in all directions across the road network in 15-minute intervals by month, year and suburb from July 2020.

“The data we capture provides context around traffic trends, accident blackspots, the most congested areas, the most dangerous roads and more,” Cardoso adds. 

The files are available on the Intelematics website.

Related Content

  • Data revolution in real time travel information
    February 3, 2012
    Damian Black, CEO and founder of SQLstream Inc, writes about relational stream processing for real-time intelligent transport systems Almost unnoticed there is a revolution going on in Internet data which is different from anything seen before. It is taking place in sensor data, which research organisation Gartner predicts in 2012 will exceed 20 per cent of all non-video Internet traffic.
  • Detection analysis technology successfully predicts traffic flows
    February 3, 2012
    David Crawford investigates new detection analysis technology from IBM. Locations on both the East and West Coasts of the US are scheduled for early deployments of IBM's new Traffic Prediction Tool (TPT) statistical analysis model for the fine-time resolution and near-term prediction of road flow conditions. Developed by IBM's Watson Research Laboratories, TPT is designed to analyse data from the the key detection indicators - average vehicle volumes and speeds passing a location in a given time interval -
  • Adaptive control reduces travel time, cuts congestion
    January 20, 2012
    Situated in San Diego County, California, the growing city of San Marcos has seen its population increase by 53.5 per cent since the turn of the century. Although this dramatic population increase has spurred economic growth bringing new business, homes and opportunities to the city, it has also increased traffic congestion along its central corridor, San Marcos Boulevard. This became the most congested arterial in the city, and, by 2006, the second-most travelled corridor in San Diego County.
  • Inrix ranks U.S. most congested developed country in the world
    February 7, 2018
    The U.S. is the most congested developed country in the world, with drivers spending an average of 41 hours a year in traffic during peak hours, costing them nearly $305bn (£220bn) in 2017, an average of $1,445 (£1,042) per driver. The findings come from Inrix’s annual Global Traffic Scorecard, which analysed 1,360 cities across 38 countries. Additionally, the study revealed that the U.S. had three of the top five most congested cities globally, costing an economic drain upwards of $2.5bn (£1.8bn). Los