
Intelematics releases Australian historic traffic flow data

Intelematics has published historic traffic flow data files for more than 2,000 Australian suburbs from 2016-19.
By Ben Spencer March 13, 2020 Read time: 2 mins
Melbourne streets: Intelematics is going back in time (© Matko Medic | Dreamstime.com)

The company says this will allow traffic management companies and consultants to better understand and plan their projects. 

The use of such data improved afternoon peak hour congestion by 14% on Hoddle Street in Melbourne, the company claims.

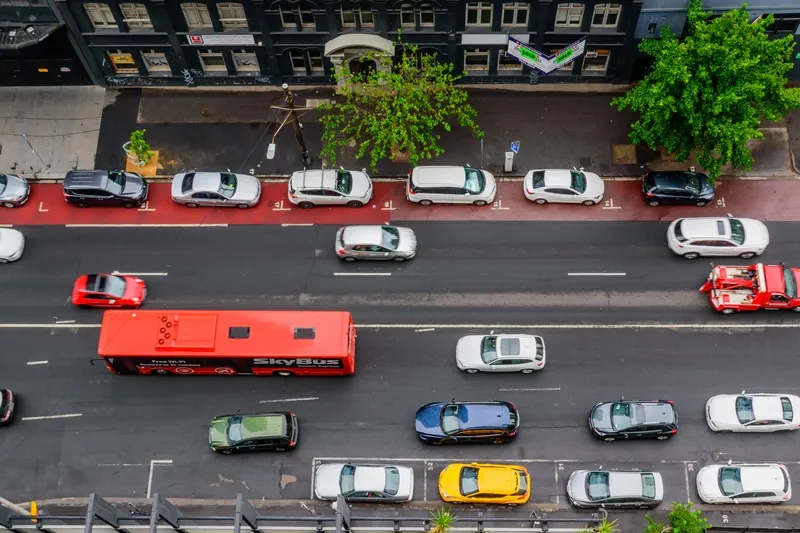
John Cardoso, Intelematics’ senior product manager, says it shows traffic flow, speed, speed limits and delays by correlations between suburbs and street names, kilometres per hour, geographic coordinates and time of day.

“The data is available in 15-minute increments. However, if customers need nine-minute, six-minute, or three-minute increments we have that too,” he continues. 

“In addition, each file purchased captures one year’s worth of traffic flow data – many companies only offer three months.”

From April, Intelematics is to roll out traffic data by month consecutively in a move which it says will allow users to access analyse 2020 road and traffic projects without having to wait a full year. 

It will also launch historical traffic volume data files showing vehicle counts in all directions across the road network in 15-minute intervals by month, year and suburb from July 2020.

“The data we capture provides context around traffic trends, accident blackspots, the most congested areas, the most dangerous roads and more,” Cardoso adds. 

The files are available on the Intelematics website.

Related Content

  • Inrix informs FHWA’s data improvements
    December 19, 2017
    Refinements in the data available from the US Federal Highway Administration will improve road management across America. David Crawford reports. In August 2017, the US Federal Highway Administration (FHWA) issued the first results from an upgraded version of its National Performance Management Research Data Set (NPMRDS). Developed to identify the locations and times of high congestion affecting traffic flows along America’s 259,000km (161,000 mile) national highway system, this is a key resource for sta
  • Taking virtual control of the control room
    June 9, 2020
    When you can’t meet customers face to face, it creates problems for all businesses. But Adam Hill finds that the control room tech sector has been adapting
  • Can AV mapping rely on crowds?
    June 29, 2021
    Mapping tech companies need to expand their data inputs beyond crowdsourcing in order to maintain temporally accurate maps at scale, says Ro Gupta at Carmera
  • Travel times halve for tolling converts
    August 5, 2013
    The Port Mann Bridge in Vancouver is a prime example of how the latest ITS systems enable new infrastructures to be built and paid for while still providing additional user benefits. Vancouver has 2.2 million inhabitants and, like so many major cities, is divided into two by a river, the Frazer river. This combination makes Vancouver the second most congested city in North America and the most congested in Canada. Through the middle of the city runs the Trans-Canadian Highway 1 which crosses the Frazer Riv