
XYZT.ai adds time to the mobility equation

Timestamps on critical ITS data allow organisations to drive additional insights
By Andrew Bardin Williams April 29, 2024 Read time: 2 mins
Data from Hamburg (image: XYZT.ai)

Location information has revolutionised the transportation industry, giving organisations pinpoint accuracy of vehicles, hazards and other road users across a variety of ITS applications dealing with traffic monitoring, autonomous driving, collision avoidance, pedestrian safety and others.

Belgian company XYZT.ai has taken this visibility one step further by adding timestamps to critical ITS data, allowing organisations to drive additional insights that take travel time and time of day into account. The company then presents this data in a visually appealing way that makes it easier for users to understand and work with the data in a meaningful way.

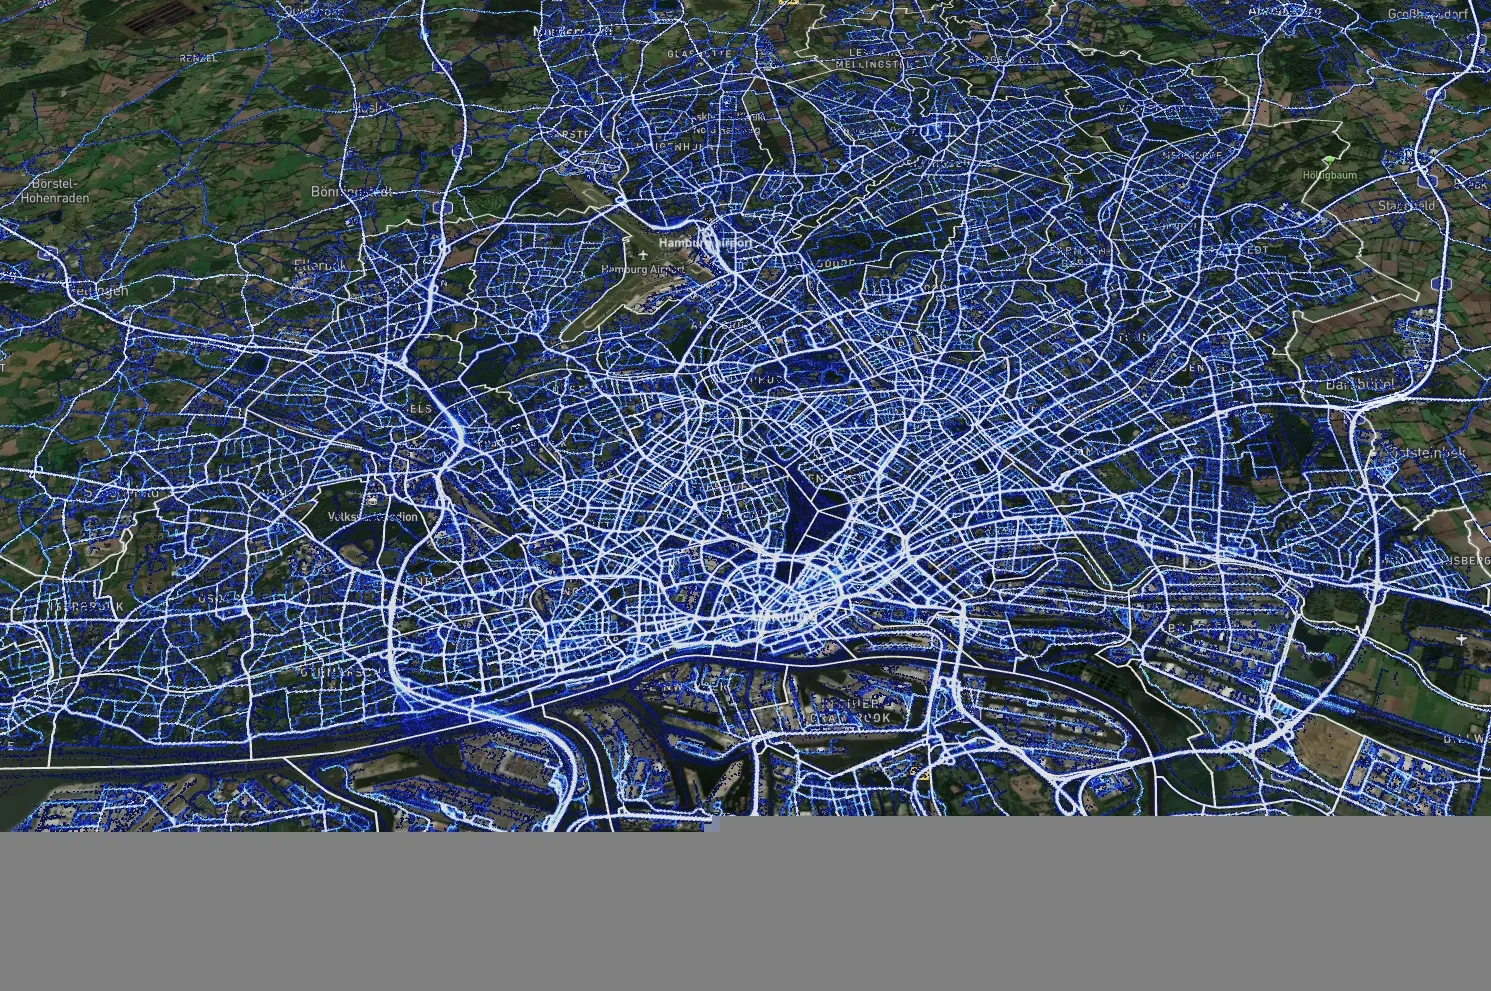
The City of Hamburg, for example, uses XYZT.ai for mobility analytics with floating vehicle data from Inrix.

According to Bart Adams, the company’s CTO, most companies look at data in the aggregate to identify trends and patterns - but it’s also important to be able to look at individual events that take place at a certain time. This includes a fleet manager tracking delivery timeframes, a delivery service optimising routes during the morning rush hour or a traffic engineer auditing travel times displayed on variable message signs. Adding time on top of location data and then presenting it in a way that is easy to consume makes this possible.

“There are billions of data points generated across a city every day,” said Lida Joly, XYZT.ai CEO, at last week's ITS America Conference & Expo 2024 in Phoenix, AZ. “It’s important that people are able to visualise this data in an effective way that allows them to make cities safer and better.”

For more information on companies in this article

Related Content

  • Turning information into stories
    April 16, 2018
    IBTTA says its TollMiner tool can transform transportation planning. Here, the tolling organisation explains how it works – and what part it might play in Donald Trump’s infrastructure plan. Imagine being able to turn the black-and-white numbers in a spreadsheet into graphics and visualisations that tell a compelling story about essential transportation infrastructure. Having easy access to the solid, reliable data you need to plan surface transportation projects and assign project resources based on
  • Ranked: the world's most congested cities
    January 22, 2025
    Inrix data suggests billions of hours are lost worldwide, hampering economies
  • Ford and StreetLight Data combine on safety  
    October 16, 2020
    Collision data and travel patterns are overlaid to see where road improvements are needed
  • Kapsch TrafficCom: 'The city is not made for cars'
    October 22, 2018
    Traffic can be a really big challenge. When you’re stuck, you’re stuck. Everything comes to a standstill. But Alexander Lewald describes how existing infrastructures can be used more efficiently and how demand can be managed. A few figures to start with: in Los Angeles, the average driver spends 102 hours a year in traffic – that’s more than four days. This figure is 91 hours in Moscow and New York, 74 in London, 69 in Paris, 51 hours in Munich and still 40 hours in Vienna. Traffic is what causes