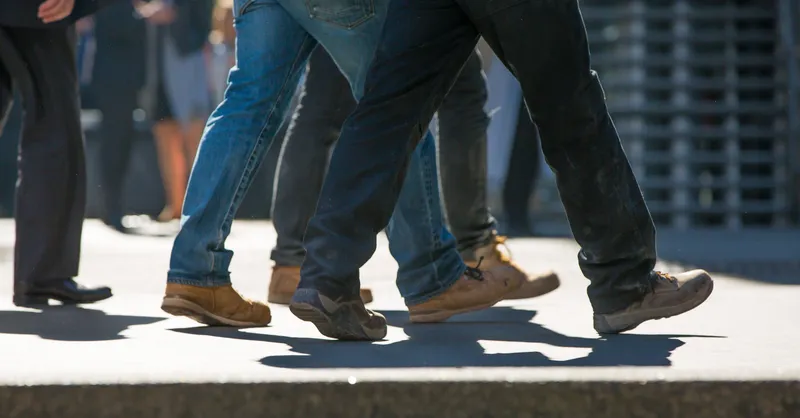
StreetLight Data is warning against relying on old data for pedestrian activity following an analysis which has revealed significant changes in 2020.
This is timely: newly-published preliminary figures from the US Governors Highway Safety Association (GHSA) suggest a 20% year-on-year spike in the rate of pedestrian deaths in the first six months of 2020 - despite the Covid-related fall in road traffic.
The US National Safety Council has already said that the fatality rate on the country's road increased by 24% - the highest increase in nearly 100 years, even as driving decreased.
Streetlight uncovered key insights from its database to help transportation planners stepping up safety initiatives.
In its study, which came out before the latest GHSA data, StreetLight set out to determine whether the traditionally higher levels of pedestrian activity in city centres has changed in 2020’s large shift to work from home bought about by the coronavirus pandemic.
StreetLight analysed the top 10 cities for pedestrian activity in its 2020 US Transportation Climate Impact Index, which included areas in Orlando, four other Florida cities, and Las Vegas, Nevada.
Walk This Way: New Data for Pedestrian Safety found people still did more walking in these areas than in the outskirts of all cities.
However, a comparison of the total number of pedestrian trip starts in 2020 to 2019 showed that while walking in city centres fluctuated only slightly, walking outside rose or fell more significantly.
For example, the aqua areas in Las Vegas show where the number of pedestrian trips stayed the same in 2020 compared to 2019. But the wide scatter of dots in purple (more than 25% decrease) and yellow (more than 75% increase) show how volatile walking became in the suburbs (and dropped in the casinos).

The analysis offers key takeaways as transportation planners focus on pedestrian safety, which include being especially wary of modelling suburban pedestrian activity based on urban data or vice versa.
Pedestrian activity also varies widely from the city centre to outlying areas, the company adds.
As part of the study, StreetLight took a closer look at pedestrian safety in Orlando to see how these takeaways play out in real life.
It focused on the neighbourhood of Holden Heights and Orlando’s central business district (CDB).
Comparing the amounts of pedestrian activity with the number of pedestrian crashes involving pedestrians for the two zones shows Holden Heights with a much higher pedestrian to accident exposure ratio.
StreetLight’s research shows the CBD has a lower pedestrian to accident exposure ratio despite having 15 times more pedestrian activity than Holden Heights.
According to StreetLight, a pedestrian walking in Holden Heights is 19 times more likely to be hit by a vehicle than if they walked in the CBD.
The company insists the CBD “is clearly able to handle large amounts of pedestrian activity in a safe manner, while the built environment or other local factors in the Holden Heights area cannot”.
StreetLight emphasises that “safety-minded” transportation planners will need to re-analyse pedestrian activity in order to prioritise zones where investments and improvements would have the biggest impact in the years to come.
They will also need to re-evaluate their models now that data older than 2020 is not applicable to current conditions, the company concludes.