
Cars take up a lot of street space, PTV shows

Animation: PTV highlights how long it takes for cars - versus other modes - to get people moving
By Adam Hill October 1, 2021 Read time: 2 mins
Simulating urban mobility: cars are rather slow, it turns out

In many ways, Covid has spurred discussion about how we want to live in the future. Lockdown measures have shown how positively less congestion and noise affect quality of life, and how the cityscape changes with more public space for pedestrians, bicycles and café terraces. The reallocation of street space is a major subject for debate.

Today, most of our cities still have a car-centric focus. We are so used to traffic jams and parked-up streets that we no longer even notice how much road space cars actually take up in our cities.

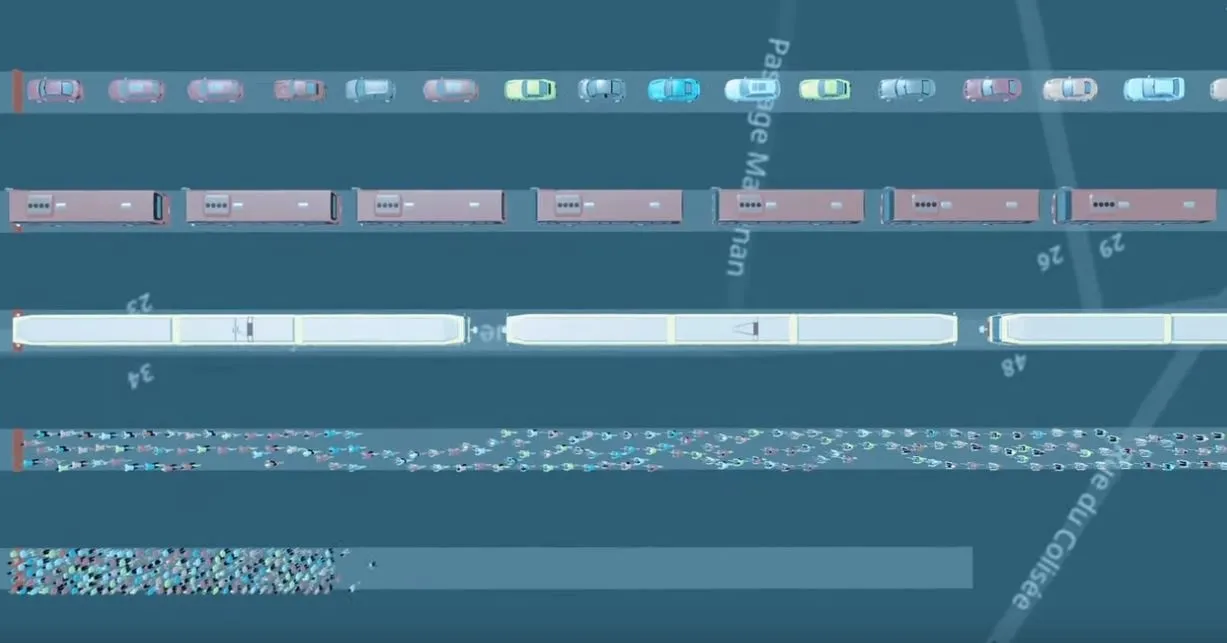
How quickly can 200 people get through a green light?

An animation by PTV Group shows how long it takes to shift 200 people past a traffic light, using various modes of transportation:

•    An average of 1.5 people in 133 private cars
•    20 passengers in 10 buses   
•    40 passengers in 5 trams
•    200 cyclists  
•    200 pedestrians

So how much space do cars take up in our cities?

Unsurprisingly, cars prove to be the most ineffective in this regard.

In the animation cars line up for more than 1km in front of the traffic light compared to the tram (197m), the buses (134m) and the bicycles (115m). The pedestrians gather on a distance of about 28m.

And how fast did they cross the traffic light once it turned green? Buses and trams take just around 30 seconds, followed by pedestrians (about 40 seconds). For cyclists, it takes a little longer to get everyone started, almost 2 minutes.

And the cars? It takes more than 4 minutes to break up the long queue.

PTV simulation - cars
 

For more information on companies in this article

Related Content

  • Safeguarding cities against wrong-way drivers
    June 10, 2024
    Thermal imaging and artificial intelligence analytics provide the best path towards preventing deadly auto accidents, explains Stefaan Pinck of Flir
  • TomTom traffic index shows increase in UK congestion
    April 1, 2015
    TomTom’s today 5th annual Traffic Index, the barometer of traffic congestion in over 200 cities worldwide, reveals rising congestion levels around the globe In addition, for the first time, the Index took an in-depth look at the true impact of rush hour traffic on the work week, uncovering that evening rush hour nearly doubles the journey time for car commuters. The analysis of 12 trillion pieces of traffic data worldwide revealed that the evening rush hour is the most congested time of day. Traffic co
  • Traffic management: risky business
    June 15, 2023
    Adding a real-time accident risk layer to the profile of a road network ticks all the crucial boxes: it saves time, fuel, money and, ultimately, lives. Harriet King of Valerann explains the brain power of Lanternn by Valerann’s Core Fusion Engine...
  • Connecting DoTs with IoT for secure, connected transportation systems
    January 11, 2022
    Michelle Maggiore of Cisco outlines how connected roadways and intersections can help improve safety, reduce traffic congestion, and minimise our carbon footprint