Enel X and Here help Italy track virus containment

Enel X and Here Technologies are launching the City Analytics – Mobility Map solution for Italian government agencies to analyse the impact of Covid-19 containment measures.
By David Arminas April 21, 2020 Read time: 2 mins
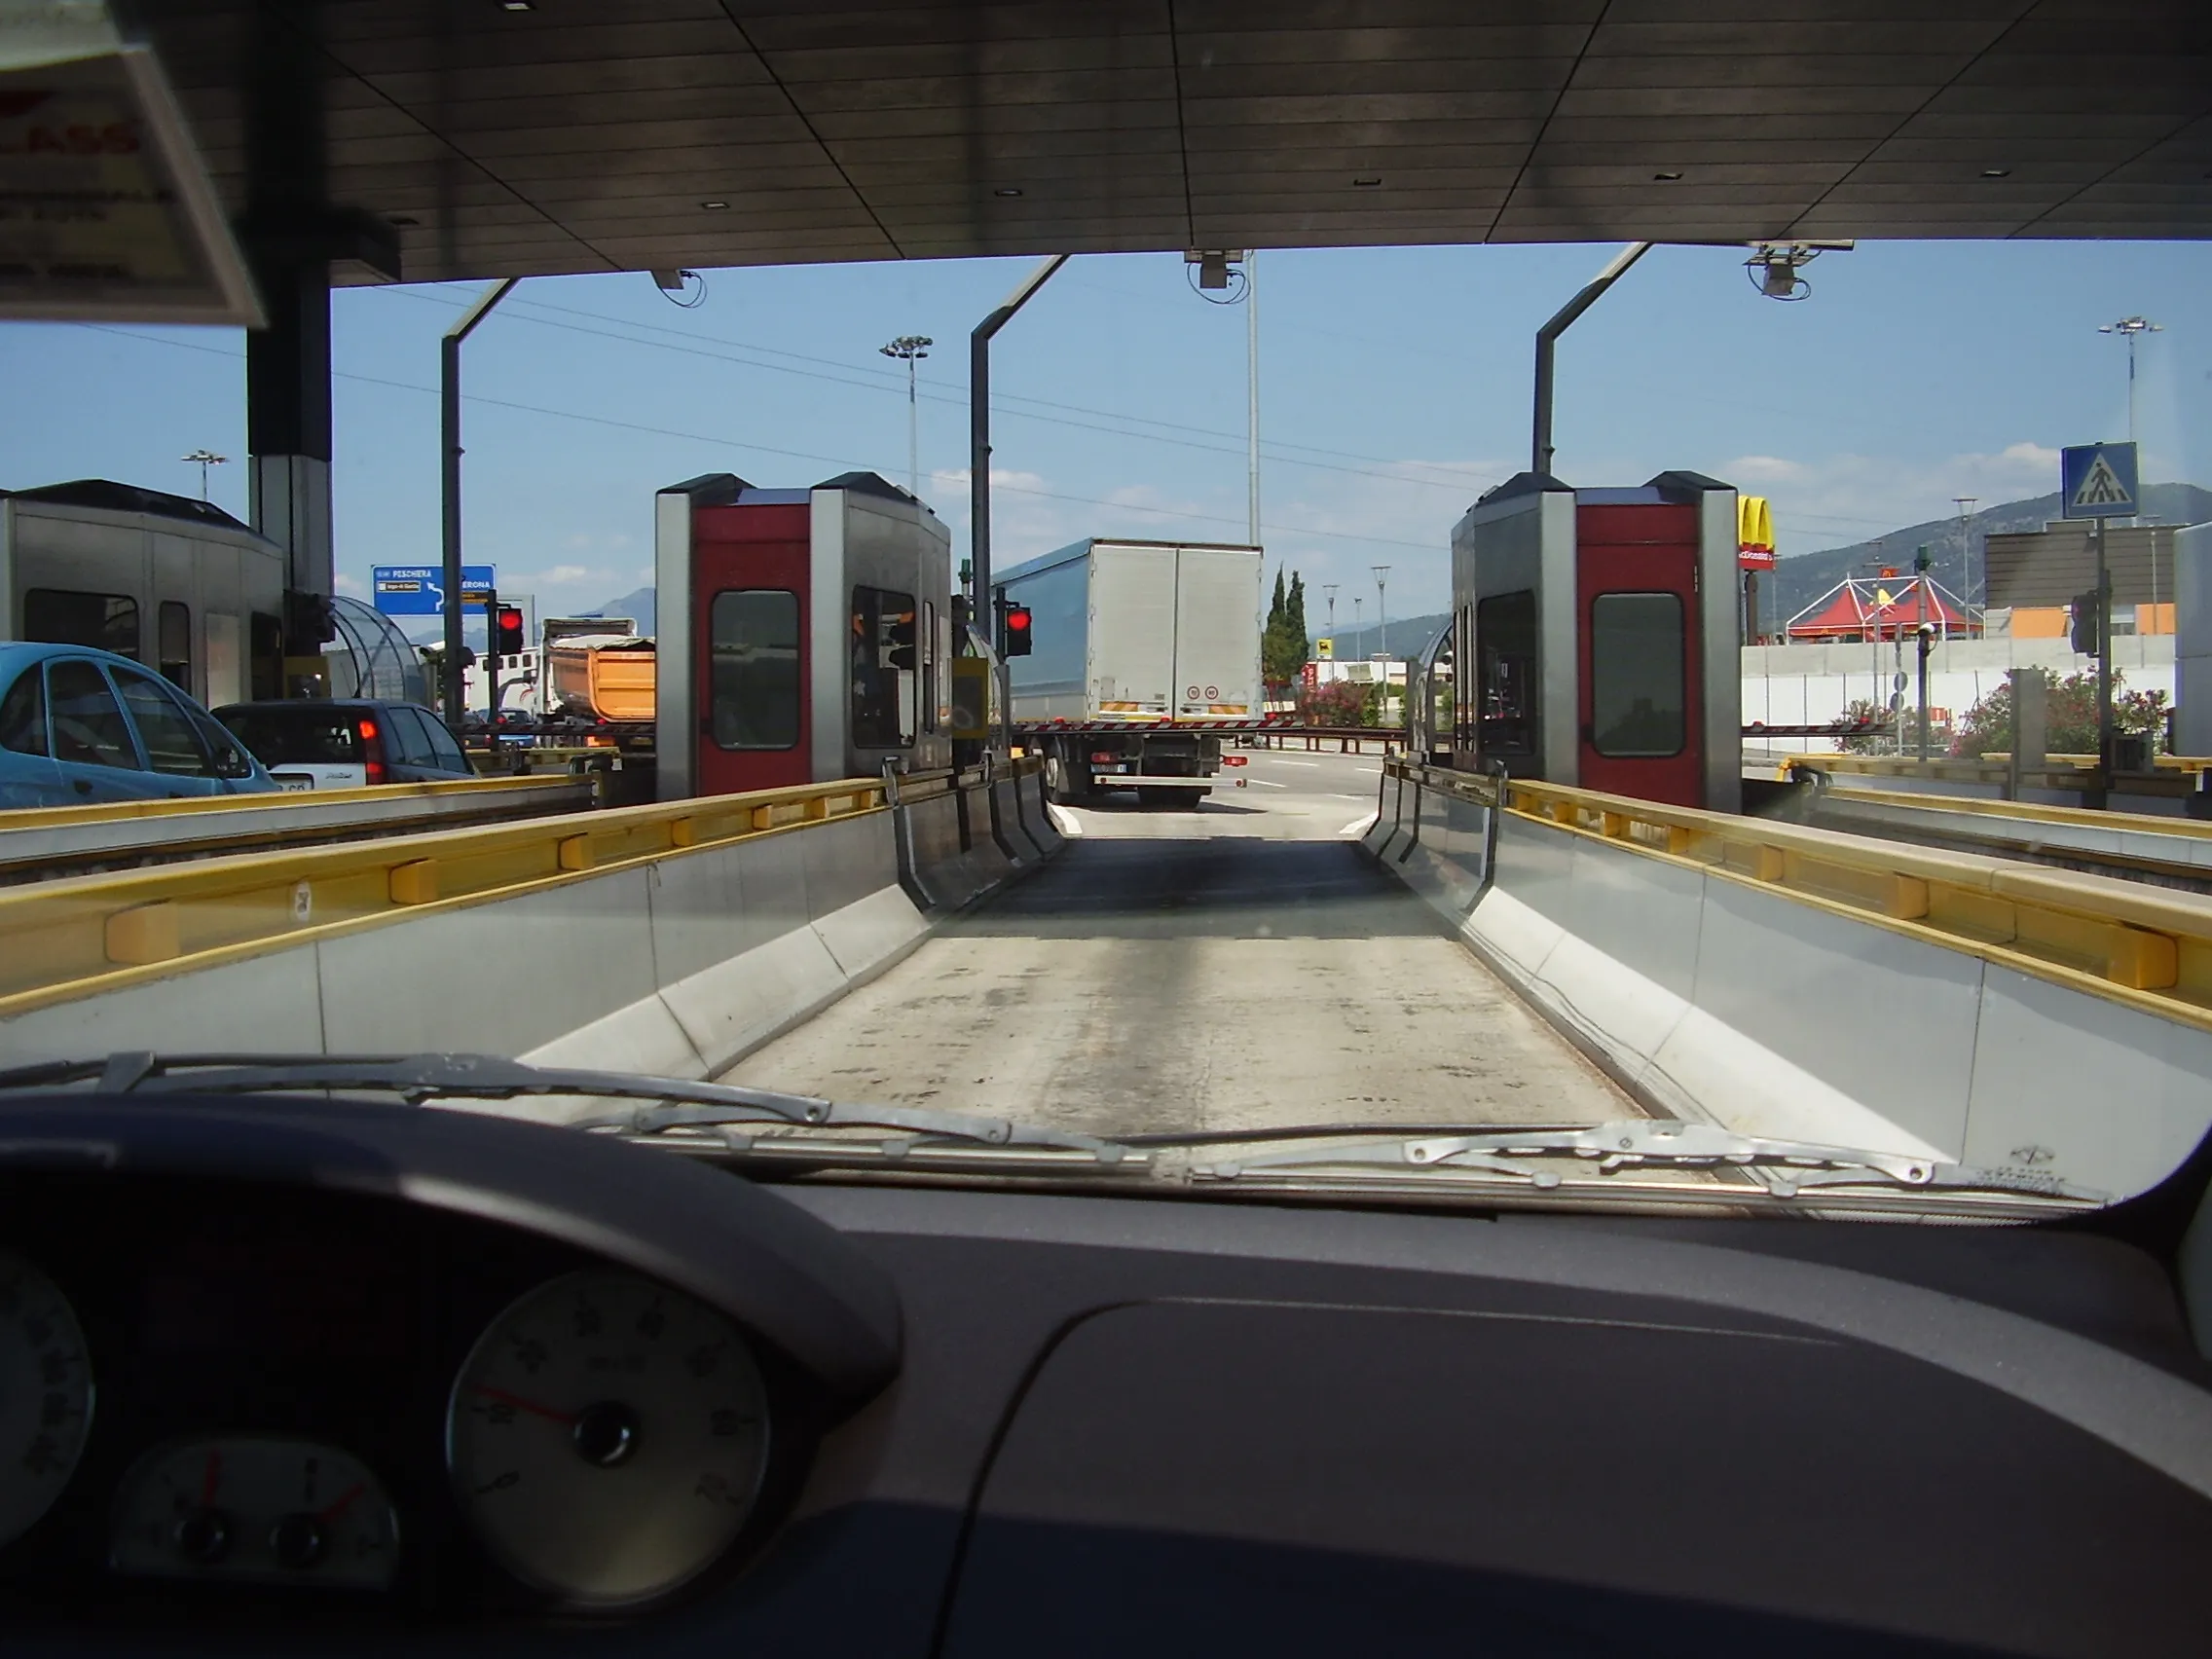
Comings and goings on Italy's roads: Enel X and Here have launched City Analytics – Mobility Map to help track Covid-19 containment measures (© Mike Woof)

Enel X, the global business line of the Enel Group, and Here, a location data and digital mapping services provider, said that the solution estimates variations in the public’s movements and kilometres travelled throughout the country.

The solution is an addition to the urban planning City Analytics suite created by Enel X for government agencies.
 
It displays anonymised and aggregated location data from connected vehicles’ sensors, navigation systems, mobile applications and government agencies.

The data processing generates four key indicators. One is the daily percentage change in the number of trips in an area, compared to a weighted average from January 2020 with aggregated regional, provincial and municipal views.

Another is the daily percentage variation in total of kilometres travelled. This is compared to a weighted average from January 2020, also with aggregated regional, provincial and municipal views.

A third key indicator is the proportion of incoming and outgoing daily trips according to the origin or the destination per region, province and municipality.

Lastly, it looks at the proportion of incoming and outgoing weekly trips according to the origin or the destination per region, province and municipality.

“Thanks to the collaboration with Here Technologies we have provided the country with an effective solution for evaluating developments in mobility flows across the territory, which can be used to plan the recovery phase,” said Francesco Venturini, head of Enel X.
 
“Together with Enel X, we hope to help the country contain and control the spread of the coronavirus while protecting the privacy of Italians,” said Edzard Overbeek, Here chief executive.
 
Government bodies and the Civil Protection Department can access the data on the Enel X YoUrban portal for free until May 31.

The available information can be used to identify areas that need more support in the implementation of these measures and analyse the gradual return to normalcy in a data-driven way, once the pandemic is over.
 
The companies said that the public will be able to access the data about daily mobility flows. They can do this through the dashboard on the Enel X website and "actively support local governments during this challenging period for Italy".

For more information on companies in this article

Related Content

  • Costing transit is complicated case
    August 19, 2015
    David Crawford welcomes fresh thinking from Canada. Public transit improvements can bring society “significantly more value” than conventional transport models normally indicate, argues Canadian researcher Todd Litman. “Traditional evaluation practices originally developed to assess roadway improvements, and focus primarily on vehicle travel speeds and operating costs. “They do not generally quantify or monetise basic mobility benefits, vehicle ownership and parking cost savings, or efficient land developme
  • Asecap Days 2023: Data drives the best decisions
    December 22, 2023
    Almost all the data being collected by highway operators is going to waste. But if firms collect and analyse these ‘vast lakes of data’ they can investigate threats, monitor management systems and drive up revenues, delegates were told at Asecap Days 2023. Geoff Hadwick reports
  • First year of growth in demand for public transport in EU ‘since economic crisis’
    June 21, 2016
    The use of public transport in the European Union has reached its highest level since 2000, with a total of 57.9 billion journeys made in 2014, according to a new study released today by UITP (International Association of Public Transport). 2014 was the first year of distinct growth in demand for public transport after years of stable demand following the start of the economic crisis in 2008. The highest total demand in 2014 for bus, tram, metro and suburban rail was recorded in Germany (10.9 billi
  • Cross referencing data sets reveals now decision support information
    November 18, 2014
    Combining previously unrelated sets of data can provide an in-depth view of travel patterns. "Through the use of analytical tools, Urban Insights seeks to help transportation organisations benefit from the vast amounts of detailed data they collect every day.”