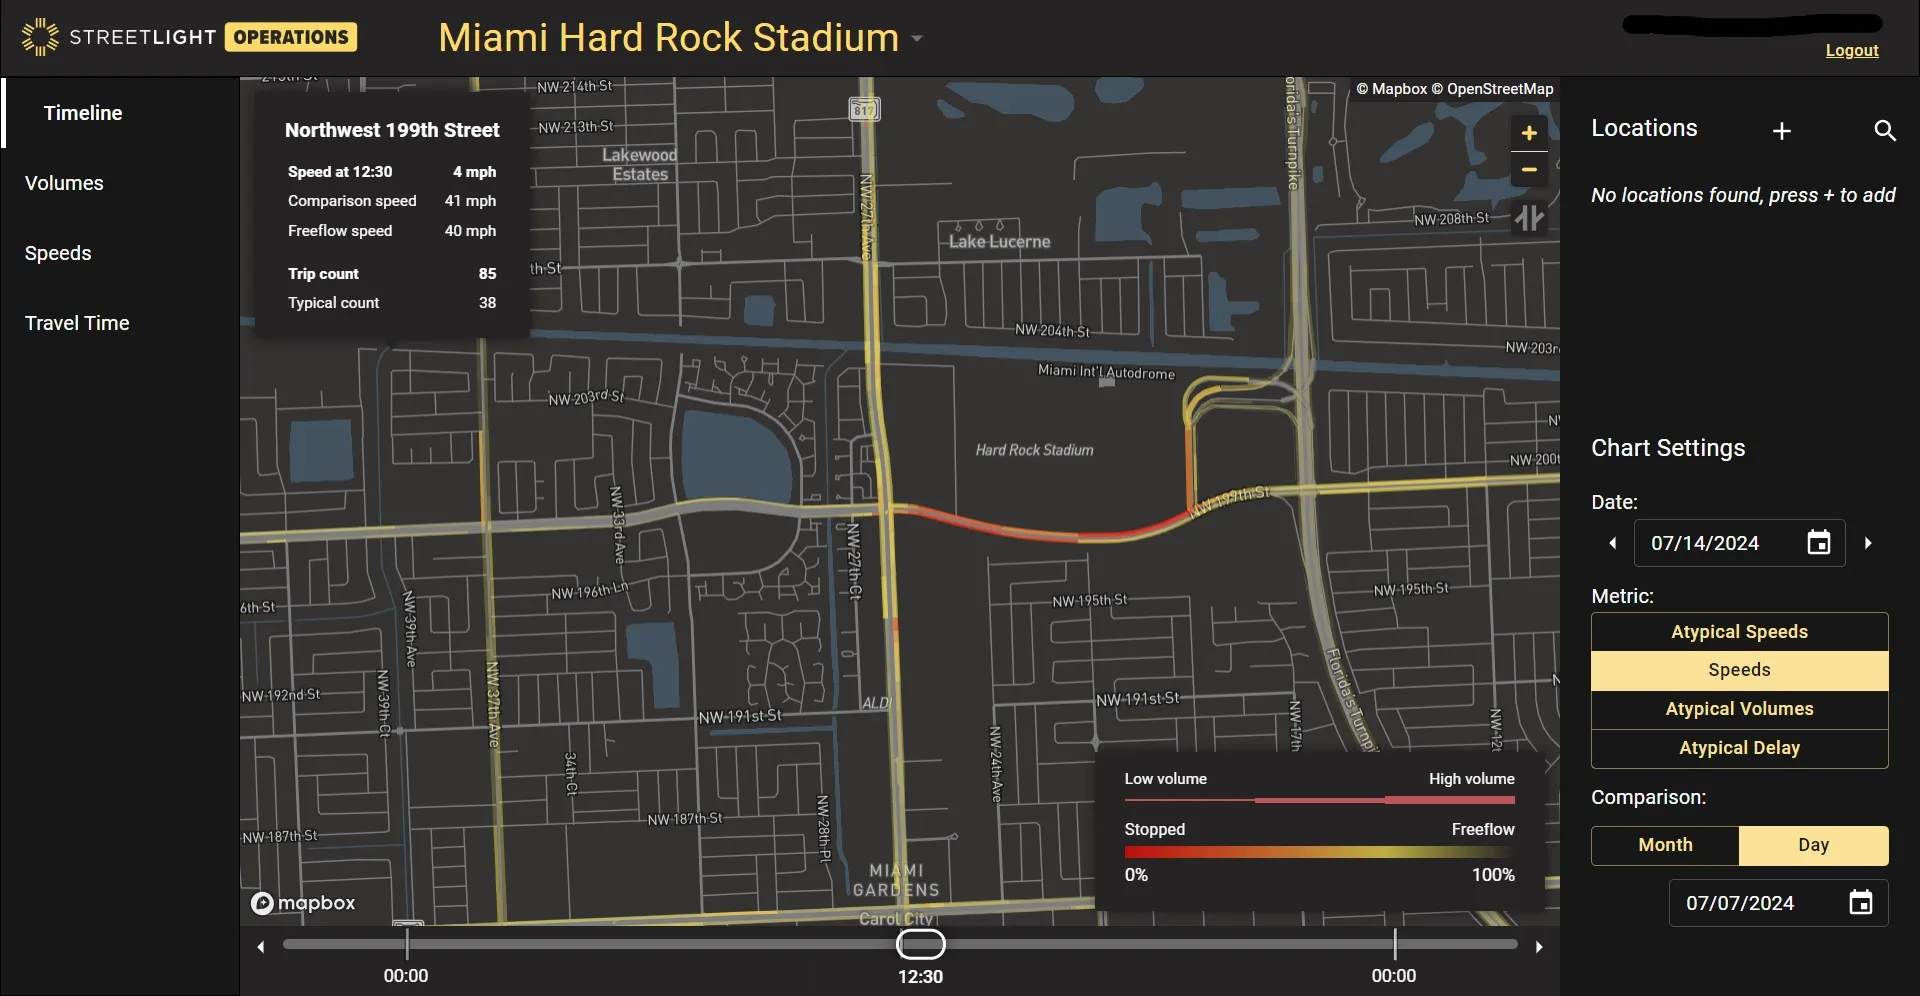
StreetLight Data, has introduced a real-time traffic disruption assessment product called Traffic Monitor.
The Jacobs subsidiary says it can instantly pinpoint and visualise disruptions - for example, with major sports events or climate-related problems on the network - as well as "their ripple effects throughout the network".
Laura Schewel, StreetLight CEO and VP of transportation software at Jacobs, says: "Customers can not only utilise comprehensive mobility information to manage and build infrastructure, they can also better operate that infrastructure in real-time, even in tough situations, all without ever installing physical sensors."
She adds: "Traffic is becoming more irregular – and traffic professionals have to cope with bigger disruptions ranging from storms to major events like the Copa America Final and World Cup.”
Customers can view recent and ongoing traffic disruptions to understand the severity and duration, allowing rapid response, StreetLight says. This can include adjusting messaging to road users.
As it also shows the performance of traffic over time, Traffic Monitor also means it can help determine whether a certain event’s traffic was managed successfully, and can point to areas for improvement in the future.
Features include:
• Daily route-based travel times
o Improve detour planning by measuring travel times and observing routes that drivers take during unusual situations
• Daily network-wide timeline view
o Respond to residents with data-driven insights about actual conditions in disrupted locations
• Daily average speeds
o Show when speeds fall well below typical, enabling proactive identification and addressing of speeding hotspots in the disruption location to ensure safety
• Real-time speeds and incidents
o Dynamically adjust traffic assessment controls with Active Traffic Management
• Historical volume & speed
o Highlight times when volumes exceed threshold for lane closure, speeding up project completion with seasonally adjusted, optimised road and lane closure window