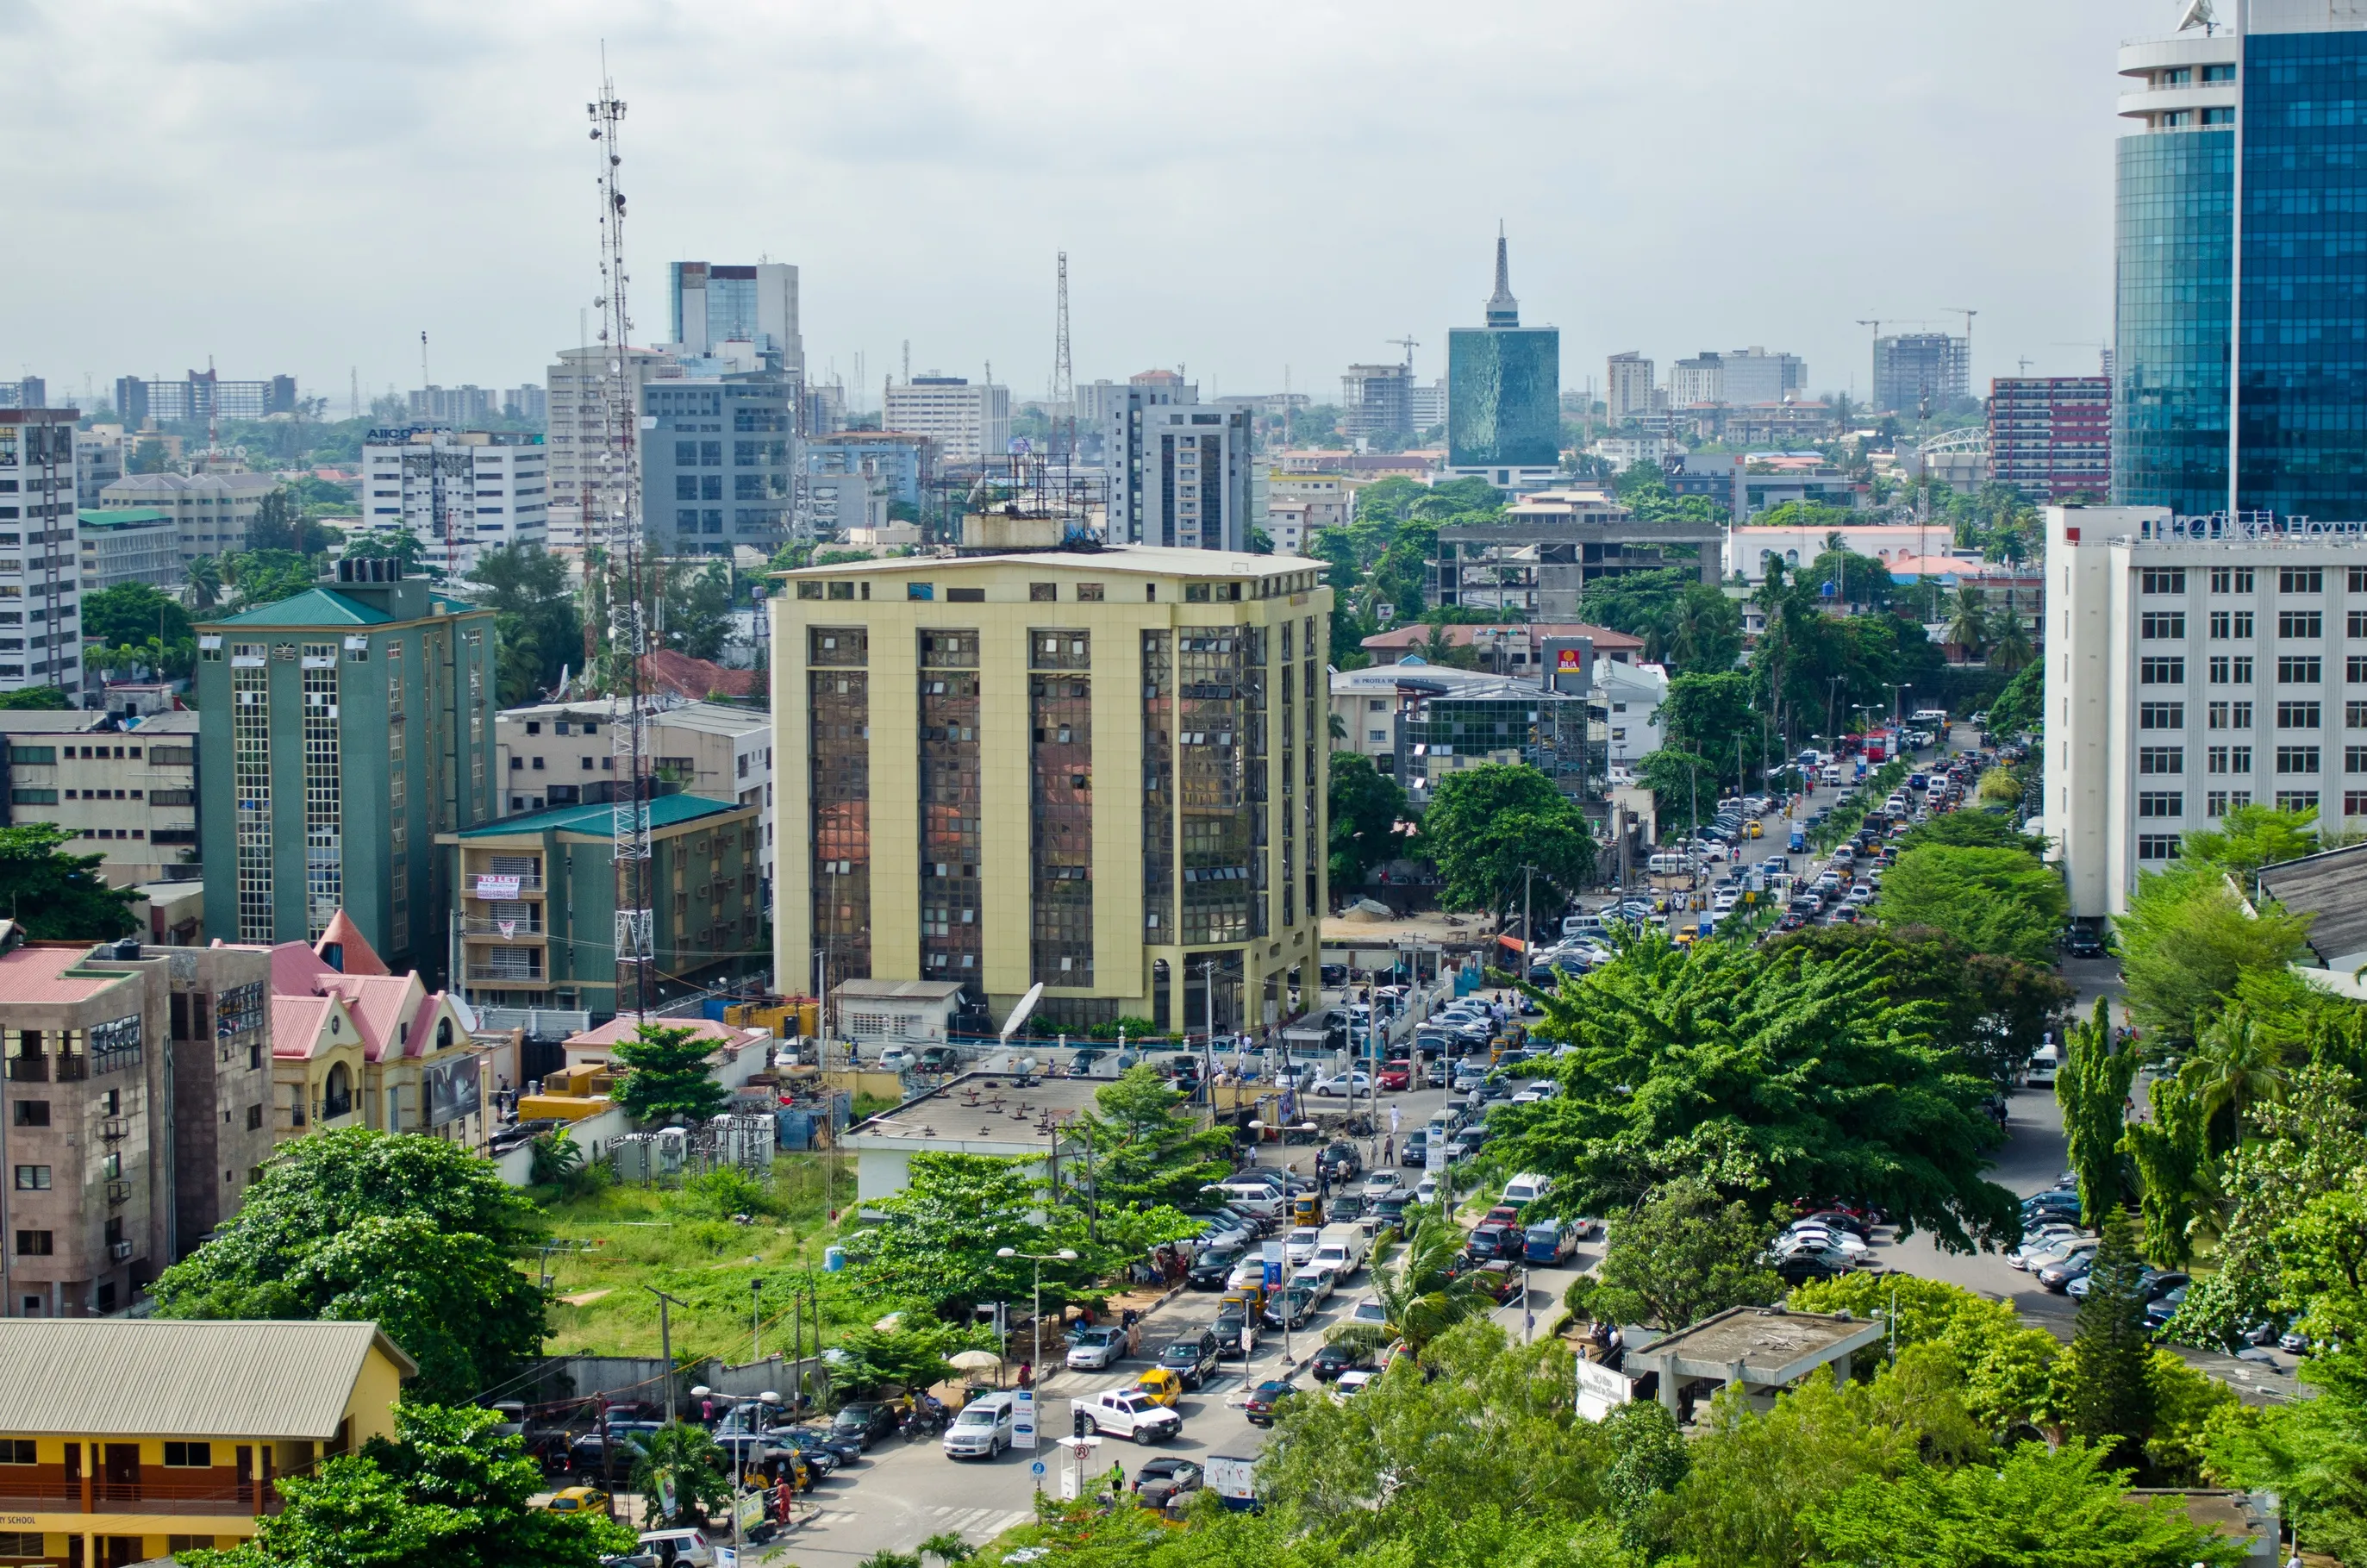
We all know that the world’s roads can be dangerous places to navigate. But a pre-Covid study reveals just what that means in reality: the Nigerian city of Lagos has 26 fatalities per 100,000 inhabitants in incidents involving at least one vehicle.
The death rate in the African country’s largest city is shocking, but other places are not that far behind, found auto parts retailer Mister Auto’s 2019 Driving Cities Index, which examined the safety records of 100 cities worldwide.
While Lagos is top of this unenviable list, it was closely followed by the US city of Orlando (23 deaths per 100,000 people), the Indian cities of Kolkata and Mumbai (both 22) and St. Petersburg in Russia (18). At the bottom comes Manchester, UK (8).
Driving culture
As part of the study, Mister Auto carried out a poll on road rage involving more than 6,000 drivers to better understand aggressiveness and general driving culture. Cities with the highest score had the most amount of road rage incidents witnessed by respondents.
The Mongolian city of Ulaanbaatar received the worst score for road rage (99.12), followed by the Russian city of Moscow (98.46), Karachi in Pakistan (98.13), Kolkata again (97.80) and Lagos once more (97.47). The Japanese city of Osaka received the top score of just 1.00 for road rage.
All three categories comprise of a total of 15 factors which have received individual scores based on raw data. For infrastructure, the index provided a score for the average amount of travel time lost to congestion.
Congestion levels were measured by comparing free-flow conditions in a city over a 24-hour period. The higher the result, the lower the impact of traffic congestion on an individual’s driving experience.
Mumbai has the worst congestion with a score of 1.00, followed by Kolkata (55.17), Ulaanbaatar (62.95), Lagos (65.10), and the Colombian city of Bogotá (70.36). The US city of El Paso and Malmo in Sweden both came first with 100.
Public transport was assessed on accessibility and affordability in a metropolitan area. Additional data was included on the ratio of the dedicated public transport infrastructure (such as mass rapid transit and bus rapid transit) per capita and per overall road length, as well as data on the share of residents who use public transport to commute.
Karachi was at the bottom of the index with a score of 1.00, while the US city of New York came first with 100.
Pollution levels
Researchers also looked at air quality levels to determine each city’s commitment to providing fresh air and good visibility for its drivers and citizens. The data focused on the annual mean for the dispersion of particulate matter (PM) 2.5 ug/m3, at a city level.
Those with the worst air quality include Lagos (1.00), Karachi (25.09), Beijing (26.05), Ulaanbaatar (29.44), Mumbai (34.18). The Australian city of Brisbane appears particularly clean, with a score of 100.
Finally, the study looked at the costs associated with driving in each city, including a cost of petrol by affordability score. It was based on the cost of the 2017 national average while the 2018 average wage by state was taken for US cities.
In first place, the US city of Boston received the highest score of 100 for having the lowest percentage of the national wage average spent on petrol. The bottom five cities are familiar from other categories: Lagos, Karachi, Kolkata, Mumbai and Ulaanbaatar.
A final score for each city was then determined by calculating the sum of the weighted average score of all 15 factors across the three categories.
The Canadian city of Calgary was ranked as the best place for driving with a score of 100. It is followed by the United Arab Emirates city of Dubai (97.87), the Canadian city of Ottawa (96.60), the Swiss city of Bern (96.23) and the US city of (96.01).
ABOUT THE AUTHOR:
Ben Spencer is news editor of ITS International