Micromobility is on the rise - or at least it was before lockdown brought it to a juddering halt.
NACTO (National Association of City Transportation Officials) has revealed people in the US took 136 million trips on shared bikes, electric bikes and scooters in 2019.
Its new report says this 60% increase from 2018 follows a yearly rise in usage throughout the 2010s, suggesting shared micromobility systems are growing in popularity and filling gaps in transportation networks.
However, the separate National Household Travel Survey showed that US household trips fell from March to April 2020 by as much as 72% due to the coronavirus pandemic.
In addition, the number of trips taken on the eight largest station-based bike-share systems decreased by an average of 44% from March to May.
NACTO's 2019 Shared Micromobility Snapshot offers lessons for where shared services have been and where the industry may want to focus as it explores new mobility options during the coronavirus pandemic, the association adds.
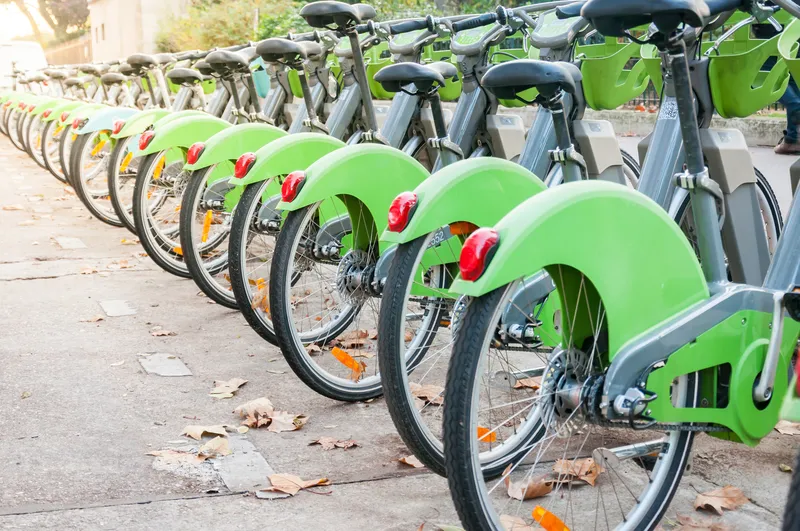
Findings for 2019 show that business was booming: people took 40 million trips on station-based bike-share systems (pedal and e-bikes), 10 million trips on dockless e-bikes and 86 million on scooters. Last year, 109 cities had dockless scooter programmes, a 45% increase from 2018.
Ridership increases were largely associated with the most established systems as people took 17% more trips on the six largest bike-share systems than in 2018. For example, Boston (Massachusetts) expanded the Bluebikes system by 540 bikes and added 50 stations, resulting in a ridership increase of 45%. For smaller systems, bike-share ridership increased overall but declined in 75% of systems.
There will be more on this survey in the North America edition of ITS International's Sept/Oct issue