Installing a lead pedestrian interval (LPI) system at 25 central business district signalised intersections in the Florida city of Lakeland has cut numbers of incidents involving pedestrians by some 60% - at a cost of US$25 for 30 minutes' work, according to traffic operations manager Angelo Rao.
He outlined the approach at a recent regional summit in Jacksonville, which brought together five south-eastern US chapters of
The system delivers a brief, exclusive signal phase dedicated to the peace of mind of pedestrians who may be slower or more reluctant to cross streets when they see the risk of conflict with vehicles turning across their paths. Lakeland operates a five-second lead; the US
The Lakeland initiative follows the summer 2017 upgrading of the city's first-ever traffic management centre - originally completed in 2007 - which replaced existing communications links with a 100% fibre network, now supporting 174 signals and delivering benefits including the low-cost of the LPI installation.
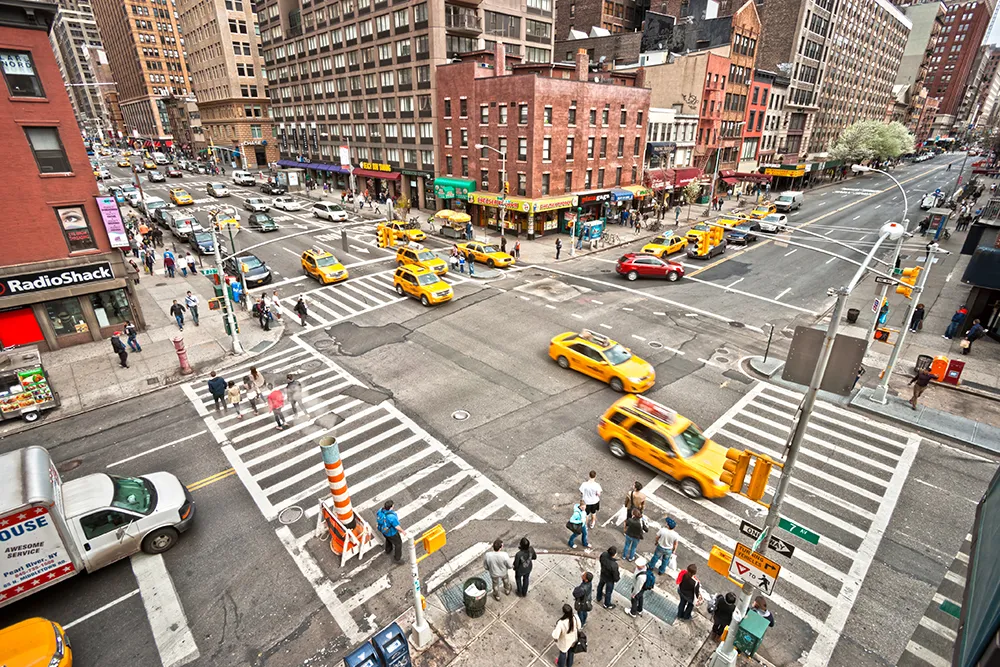
A figure such as this offers a strong incentive for widescale implementation given that, across the US, 37% of pedestrian injury crashes and 20% of fatal ones occur at intersections. Conventional deterrents include warning signs drawing the attention of people on foot to the risks, or encouraging drivers to give way. But these rely on voluntary behavioural responses; while public education and even enforcement campaigns have not always delivered measurable long-term benefits.
LPI is also highly relevant for older pedestrians. Analyses of past incidents have shown that the 65+ group is the worst affected, owing to its reduced peripheral vision and mobility, and ability correctly to judge what are safe gaps in traffic. The FHWA’s Handbook for Designing Roadways for the Ageing Population specifically recommends LPI use at intersections that experience high volumes of turning vehicle volumes.
Annual savings
As rough guidance on the ‘where and when’ implementation, the US National Association of City Transportation Officials has concluded that, given low costs of LPI installation at locations where pedestrian signals already exist, a modest reduction in incidents will justify the expenditure (for example, if the savings work out at more than US$115 per year.
Factors such as these are driving increased levels of take-up throughout the US. In 2017, for example,
There has been no shortage of ‘before ¬and¬ after’ studies and straightforward economic analyses confirming LPI as a low-cost tool capable of reducing vehicle–pedestrian conflicts and crashes at signalised intersections. Yet despite this evidence, there has until recently been a lack of guidance for municipalities on the most appropriate economic conditions in which to consider implementation. Not least among factors needing greater consideration is the cost of the contingent delays to vehicles.
Benefits calculation
The new approach enables municipalities to work out the probability of an incident occurring and then decide whether to implement LPI at a given location on the basis that the likely pedestrian safety benefits will exceed the costs of the resulting increased delays to vehicles. The team used a
simple simulator developed in Microsoft Excel to make the calculations benefits faster than would have been possible with more complex micro-simulators on the market.
As a demonstration site, researchers chose an intersection in Portland, estimating pedestrian counts by combining readily available vehicle turning movement and pedestrian signal actuation data. They found that the cumulative increase in traffic delay per day with LPI on a single-street basis was 33.55 vehicle hours, costed at a standard US$13 a time, totalling US$436.15. On a two-street basis, the vehicle hours tallied 67.38, generating a figure of US$875.94.
On the pedestrian side of the equation, the team took the US$273,465 weighted average comprehensive cost per traffic crash (which can range in severity from fatal – US$4,628,000 - to no-injury – US$2,600). They then multiplied this by the 0.0001 probability of a traffic conflict causing a crash (calculated by the US National Research Council's Highway Research Board) to generate a figure of US$27.30 in savings per conflict.
In what they offer as a ‘simplistic assessment’, therefore, LPI for a single street would be applicable when its daily total of traffic conflicts is greater than 16 (US$436.15/US$27.30) and for both streets when it is greater than 32 (US$875.94/US$27.30).
The benefit/cost ratio can be increased by restricting LPI operation to defined times of day, or making it available by push button – as is being piloted in Lakeland.
Cyclists too
A roll-out of the concept to other US vulnerable road users is now under way in New York City to cover cycling – its fastest-growing mode of transportation. A key safety challenge emerged in the 2017 BikeNYC2020 survey by not-for-profit lobby Transport Alternatives.
This reported that cyclists were feeling intimidated by motor vehicles, that were capable of greater acceleration, being lined up behind them as traffic lights turn green and often showing aggression at what they perceive as the cyclists slowing them down. Almost all the crashes in the city in which a cyclist is killed or seriously (89%) happen at intersections.
In March 2018, therefore, NYCDoT launched a pilot programme formally allowing cyclists to take advantage of pedestrian head-start signals at 50 designated equipped intersections in three of its boroughs, following isolated trials at certain sites, for which they used temporary signage. The initiative was the brainchild of NYC council member Carlos Menchaca, a regular cyclist himself, who introduced the necessary legislation in 2016.
The follow-up NYCDoT study Cycling at a Crossroads, published last September, identified the need to develop strategies to improve signal coordination and new approaches. Among these, it is investigating a 'delayed turn' approach that builds on the benefits of the LPI. Bicycles are given a minimum 10-second head start with a green bicycle signal.
Following this, turning drivers receive a flashing yellow arrow signal and can turn if their way is clear. Video analysis of trial locations has shown that this delivers the lowest total rate of interactions between cyclists and vehicles and, when surveyed, 63% of respondents stated that they felt safe - despite a degree of conflict at the start of the flashing yellow arrow phase. NYDoT is currently evaluating design approaches to improve the operation of the system.